
Allothereua serrulata, Verhoeff, 1925
|
publication ID |
https://doi.org/ 10.1111/j.1096-3642.2009.00564.x |
|
persistent identifier |
https://treatment.plazi.org/id/5757BE3C-FFAD-FF86-FC87-D18FFAA86297 |
|
treatment provided by |
Felipe |
|
scientific name |
Allothereua serrulata |
| status |
|
ANALYSIS OF ALLOTHEREUA SERRULATA View in CoL SUBSPECIES
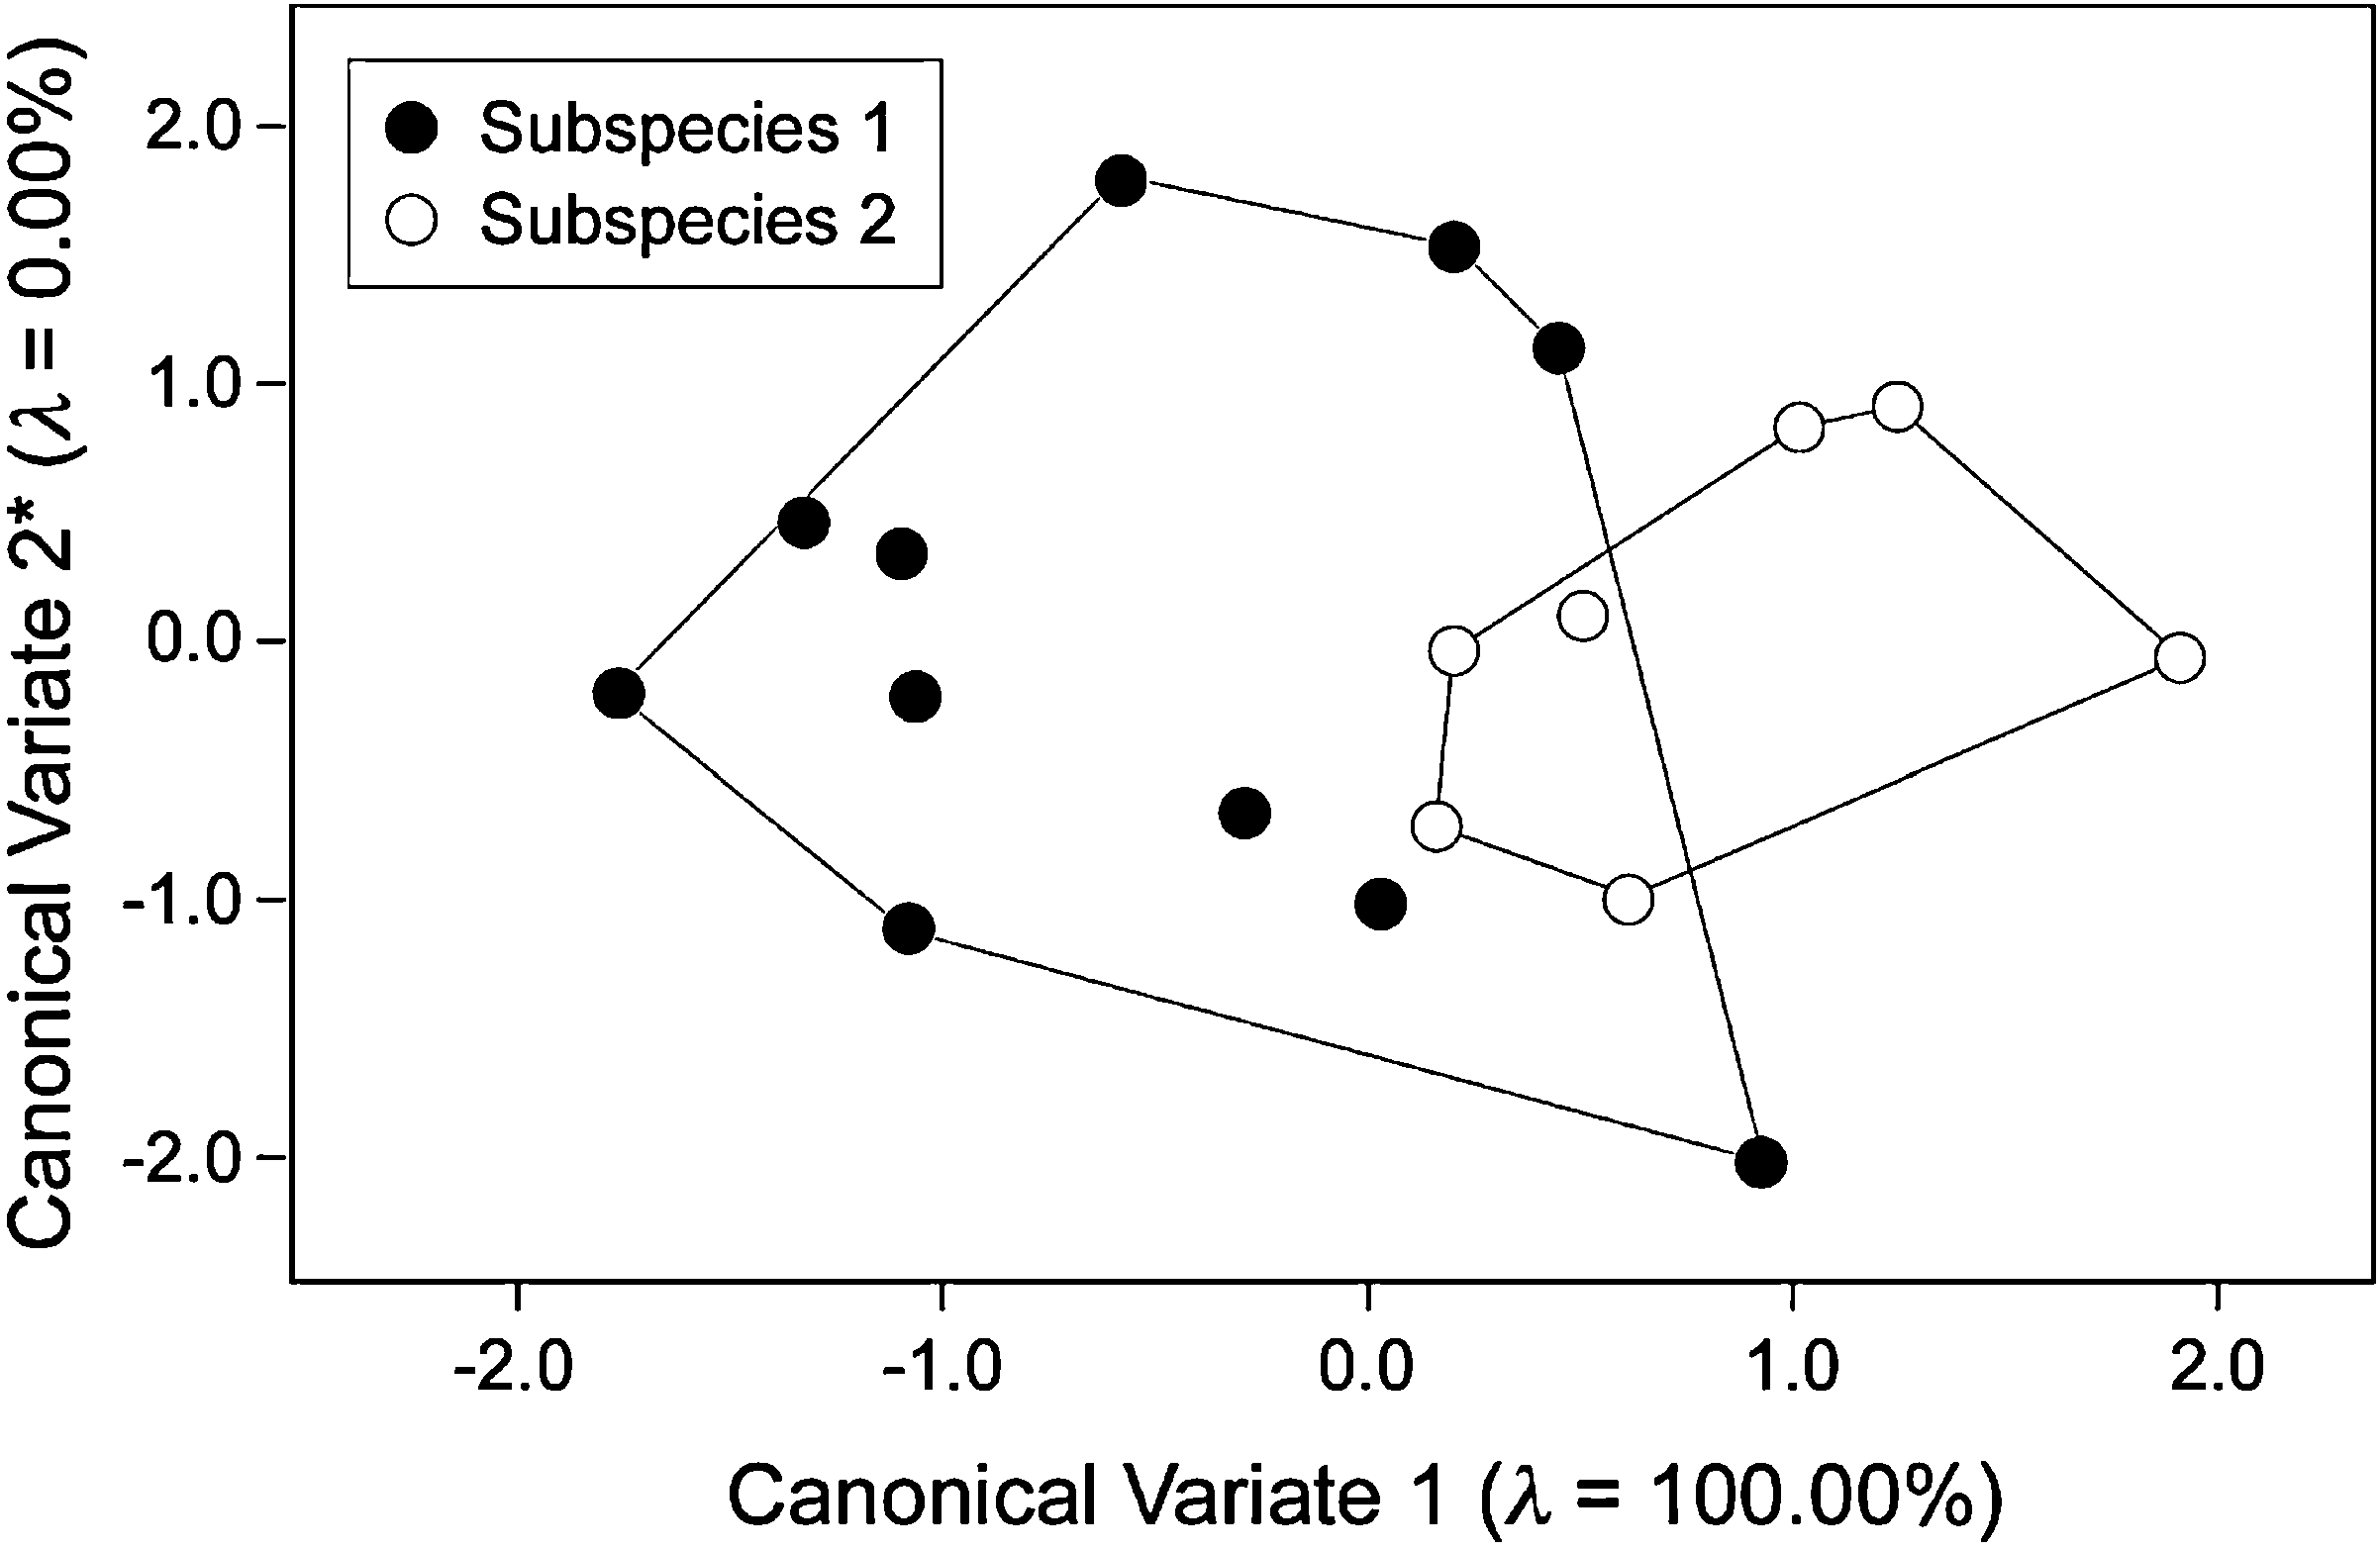
In the final analysis we applied the same morphometric approach to a comparison of putative A. serrulata subspecies recognized on the basis of tergal spine/ bristle associations. Figure 11 View Figure 11 shows a plane through the canonical variates space for the comparison of two samples of gonopods whose shape was assessed using the landmarks shown in Figure 1A View Figure 1 . Scores for individual shapes on the first four relative warp axes were used as input to the CVA routine as these axes accounted for 95% of the observed shape variation in the pooled sample.
Because there are only two groups in this dataset, there is only one between-groups canonical variate axis, CV-1. This axis is aligned with the two group centroids and is usually described as explaining ‘all’ between-groups difference. That traditional description is somewhat of a misnomer in that the purpose of this axis is only to align the primary dimension of the canonical variates discriminate space with the first eigenvector of the between-groups covariance matrix, which is the matrix of paired covariances between group centroids (see Campbell & Atchley, 1981). What are not readily acknowledged, discussed, or presented in CVA studies are the higher-level CVA axes, which represent eigenvectors 2 – m (where m is the number of variables used in the analysis) that are specified by the first axis rotation and remain after that rotation is scaled by the first rotation’s eigenvalues (= that serve as input to the second and final canonical rotation). These axes exist as mathematical constructs in a CVA analysis, but they are usually assigned a very low eigenvalue – effectively 0.0 – and so are typically discounted. A projection of the subspecies landmark data onto the first of these ‘zero-value’ canonical vectors is shown in Figures 11 View Figure 11 and 13 View Figure 13 purely as a graphical convention.
As can be seen from Figure 11 View Figure 11 , A. serrulata subspecies 1 (ssp. 1) exhibits consistently lower scores on the CV-1 axis and a higher overall shape variance than subspecies 2 (ssp.2). This higher variance does not appear to be a function of the slightly larger sized sample obtained for this species, at least in terms of the analysis of this dataset. Although no improvement in group separation is achieved by CV-2, the scatter of points along this axis suggests that there may be a pronounced heterogeneity in gonopod shape within A. serrulata ssp. 1 as three individuals are being ‘pulled up’, well away from the main A. serrulata ssp. 1 point cloud along this axis. The existence of these points is the primary reason for the apparent overlap of the two subspecies’ convex hulls. Despite the apparent separation of these subspecies point clouds in Figure 11 View Figure 11 , a Wilks’ L test of the relative warps scores partitioned by subspecies failed to reject the null hypothesis of no between-groups difference at the 95% confidence level (Llandmarks = 2.544; c.v. a=0.05 = 3.179).
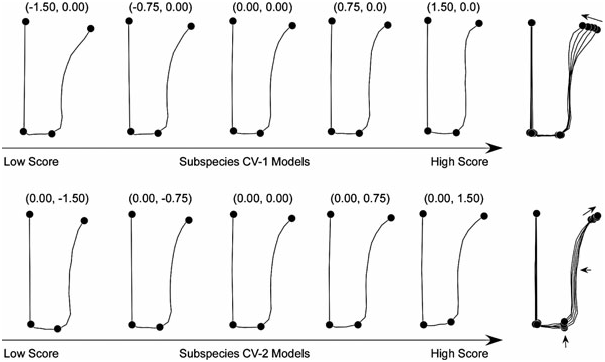
Although there is insufficient separation between these subspecies group centroids relative to withingroup variance to support a conclusion of consistent gonopod shape differences on statistical groups at the 95% confidence level (but see below), one can adopt a purely descriptive approach and ask what geometric distinctions are being represented in the space shown in Figure 11 View Figure 11 and what level of partitioning between subspecies could be achieved by using CV-1 as a discriminant axis. The back-calculated shape models for both CV-1 and CV-2 are shown in Figure 12 View Figure 12 . Because these axes lie at a relatively high angle to one another in the space of the original relative warp space (48.9° in the plane of relative warps 1 and 2), the shape transformations depicted by the axes are relatively distinct.
Consistent with its status as the sole groupdiscriminant axis, CV-1 encodes a transformation from gonopods exhibiting relatively broad mesarthra and proarthra (low scores) to those exhibiting a relatively narrow form. As one moves along the CV-1 axis this transition comes about primarily via a convergence of landmarks 1, 2, 3, and 5 towards landmark 4 within the model plot, accompanied by the shift of landmark 4 to a more medial and slightly more posterior position. This narrowing of the mesarthon is differentially intense in the region represented by landmark 1 (= the sinus). Overall, the CV-1 deformation pattern suggests that A. serrulata ssp. 1 is characterized, on average, by a broader gonopod than A. serrulata ssp. 2, although there is a region of broadly similar gonopod shapes in this respect that occurs in both subspecies.
Shape variation along the CV-2 axis is geometrically much simpler, consisting of little more than a relative decrease in the length of the mesarthron relative to the proarthron, brought about via the posterior shift of landmarks 1 and 4. Examples of this gonopod shape-variation mode occur in both subspecies, especially A. serrulata ssp. 1, which includes the most anteroposteriorly expanded (extreme low score on CV-2) and compressed (extreme high score on CV-2) mesarthral forms. Cross-tabulation analysis of the CV-1 CVA scores based strictly on proximity to the two group centroids assigns 84% of this sample to the correct subspecies with the most consistent assignment occurring in A. serrulata ssp. 2 (100% correct, see Table 5).
Mesarthral shape for these subspecies was also analysed using extended eigenshape analysis with the three outline sectors represented by 12, six, and three semi-landmark points for the sinus, posterior margin, and lateral margins, respectively. A total of seven eigenshape axes was needed to account for 95% of the observed shape variation in the pooled Allothereua subspecies sample. These were used as the primary input to a CVA analysis. As with the corresponding relative warps analysis, a Wilks’ L test of the eigenshape scores partitioned by subspecies failed to reject the null hypothesis of no betweengroups difference at the 95% confidence level (Loutlines = 2.482; c.v. a=0.05 = 3.135). The resulting descriptive discriminant space is shown in Figure 13 View Figure 13 .
Comparing the relative warps ( Fig. 11 View Figure 11 ) and eigenshape discriminant spaces ( Fig. 13 View Figure 13 ) reveals an overt similarity between the two plots. There appears to be marginally less between-groups overlap in the eigenshape space, owing no doubt to the higher information content of that dataset. This is the marginally higher significance of the Wilks’ L value for the eigenshape result (Routlines = 0.093; Rlandmarks = 0.090). Still, both results fail the significance test if the 95% criterion is used, but both pass if the significance criterion is reduced to 90%. It is also interesting to note that the three outlying individuals noticed in the relative warps-based CVA analysis are also outliers in the eigenshape-based CVA analysis, albeit with different relative orientations along CV-1.
Back-calculated, along-discriminant-axis models for the subspecies outline data are shown in Figure 14 View Figure 14 . As these two axes form an angle of 90° in the space of the first two eigenshapes, the modes of shape variation they represent are formally uncorrelated. As with the Allothereua species analyses and previous landmark analyses for these subspecies, the differences between the mesarthra of these two subspecies are primarily focused on the nature of the sinus. However, whereas the previous set of deformation models could only indicate that some interesting contrast appeared to be localized in the general region of the sulcus apex, the outline analyses is much more successful in capturing precisely what this difference is.
Along CV-1, this difference is expressed as a transition between a markedly and broadly recurved sinus outline with the sinus outline’s departure from subparallel to the mesarthral lateral margin occurring nearly half-way down the sinus’ length (low scores) to a sinus outline that is subparallel with the lateral margin of the mesarthon for c. 90% of its length and curves sharply to terminate at the sinus apex after a relatively short, lateral translation. With the exception of this proximal portion of the sinus outline, the remainder of the mesarthral outline is essentially unchanged over the entire length of the CV-1 axis.
The highly localized character of shape change along the CV-1 axis contrasts strongly with the pattern of shape change represented by CV-2. These shape models indicate that, in both subspecies, there exists a subdominant shape transformation trend in which the entire sinus and posterior margin is involved. This trend is best described as an anterior shift in landmarks 1 and 2, coupled with a strong mesial migration of landmark 1 within the model plot along with the entire set of sinus semi-landmarks. The effect of this shape change mode is to increase the width of the mesarthral sinus along its entire length, and slightly decrease the mesarthral length in the vicinity of landmark 2, moving from low scores to high scores along the CV-2 axis.
A cross-tabulation analysis of the CV-1 scores based strictly on the proximity of the projection of individual scores to the two group centroids assigned 83% of this sample to the correct subspecies, with both taxa exhibiting consistent assignment accuracies ( Table 6). The similarity of the two subspecies’ discriminant results suggests that the bulk of the changes characteristic of this putative taxonomic designation are reflected in mesarthral shape and that, despite the Wilks’ L results (which are statistically significant at a very high level and would be likely to become more so were larger sample sizes obtained), on a purely descriptive level for these two samples, broad and consistent differences between the shapes of these structures were revealed down to the subspecific level. As has been noted before, it is doubtful that such fine geometric distinctions between samples of comparable size could have been recognized using a qualitative approach to morphological analysis.


No known copyright restrictions apply. See Agosti, D., Egloff, W., 2009. Taxonomic information exchange and copyright: the Plazi approach. BMC Research Notes 2009, 2:53 for further explanation.
|
Kingdom |
|
|
Phylum |
|
|
Class |
|
|
Order |
|
|
Family |
|
|
Genus |