
Allothereua undetermined
|
publication ID |
https://doi.org/10.1111/j.1096-3642.2009.00564.x |
|
persistent identifier |
https://treatment.plazi.org/id/5757BE3C-FFA9-FF9A-FC2A-D1ACFBC46256 |
|
treatment provided by |
Felipe |
|
scientific name |
Allothereua undetermined |
| status |
|
ANALYSIS OF ALLOTHEREUA SPECIES
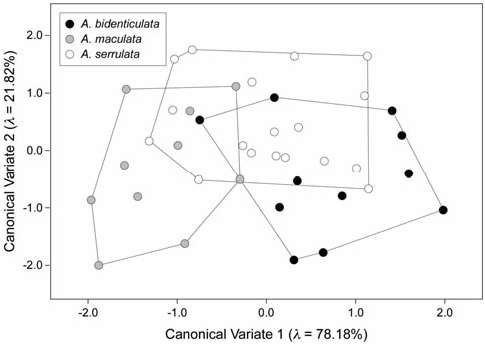
Applying this same approach to the discrimination between three Allothereua species ( A. bidenticulata , A. maculata , A. serrulata ), Figure 7 View Figure 7 shows the ordination of subequal-sized samples of each species for both between-groups canonical variates as assessed from the landmark dataset. Four relative warp variables were used as a basis for this CVA as together these axes represented 95% of the observed shape variation in the pooled sample. Although these four variables were sufficient to devise a complete discriminant space for the three species considered here, this would not necessarily be the case for an analysis of a more speciose group.
Centroids of the three species point clouds appear well separated in ordination space. This impression agrees with a Wilks’ L test of the relative warps scores partitioned by species, which rejected the null hypothesis of no between-groups difference at the 95% confidence level ( Llandmarks = 4.569; c.v. a=0.05 = 2.082). The strength of this result might appear counterintuitive when compared with the Figure 7 View Figure 7 plot, but we stress that the representation of the limits of species variation using convex hulls is simply a graphical convention. In particular, this form of representation is sensitive to the presence of outliers in the data and can misrepresent group distinctiveness when the points that define the group exhibit a patchy distribution. Taking the most well-sampled species, A. serrulata , as a basis, the ‘overlap’ with A. maculata and A. bidenticulata consists of four and three specimens, respectively. As is evident from Figure 7 View Figure 7 , the primary shape distinctions along the two between-groups discriminant axes are contrasts between A. maculata and A. bidenticulata (CV-1) and between these two species and A. serrulata (CV-2).
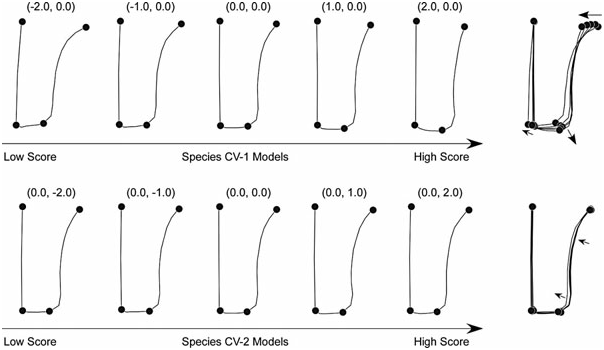
The geometric nature of these shape distinctions is represented by the along-CV-axis shape model sets shown in Figure 8 View Figure 8 . As before, these models were determined by back-calculating the axis rotations and scalings implicit in the CVA procedure such that the position and orientation of the CVA axes in the space of the original relative warp variables could be determined.
The shape variation modes expressed on the two between-groups discriminant axes are very similar owing to the small angle between them in the space of the relative warps data that served as the basis for the CVA analysis (18.6° in the plane of relative warps 1 and 2). As was true in the previous analysis of genera, the overall character of the shape contrast represented by both axes is one of forms characterized by a relatively wide and short mesarthron coupled with a wide and relatively long proarthron (low scores) transforming into forms with a narrow and long mesarthron coupled with a narrow and relatively long proarthron (high scores). Indeed, the most salient difference between the two models involves landmark 5 whose shift along CV-1 includes a slight laterally directed migration within the model plot. Along CV-2 the landmark 5 shift suggests a similar relative length reduction in the proarthron, but none of the lateral redirection. Aside from this, the major difference between CV-1 and CV-2 landmark shift patterns appears to involve small changes in relative magnitude with almost no changes in relative direction. Overall, the degree of lateral gonopod compression is greater along CV-1 than CV-2 as befits the fact that CV-1 is the axis that represents the dominant discriminant trend.
Again, the subtlety of these shape distinctions is such that it is doubtful they could be recognized using traditional, qualitative inspection of the morphology. Irrespective of this subtlety though, they are real and consistent components of the character of shape variation in this sample, as indicated by the Wilks’ L test and the Figure 7 View Figure 7 ordination. A cross-tabulation analysis of this ordination ( Table 3) shows that more than 70% of the gonopods can be placed into the correct species groups based on this rather sparse set of A., Allothereua .
landmark data alone, with higher consistency given to the A. bidenticulata and A. maculata identifications.
For the mesarthral dataset as assessed by extended eigenshape analysis, the outlines of these structures were subdivided into three segments at the landmarks (see Fig. 1B View Figure 1 ) and the raw set of equally spaced semi-landmark points interpolated down so that each segment’s outline trace was represented to a consistent level of accuracy. This procedure resulted in the mesarthral sinuses, posterior margins, and lateral margins being represented by 11, 6, and 3 semilandmarks, respectively. As before, this interpolation meant that shape variation in the sinus had a differentially large influence on the overall result.
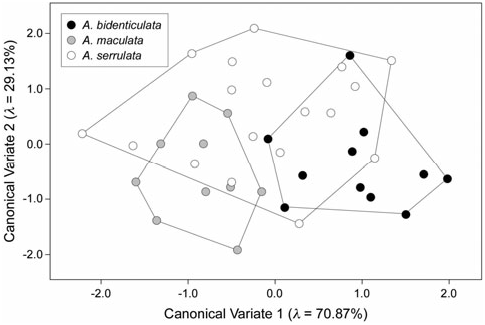
A total of seven eigenshape axes was used to construct the discriminant space as this was the number required to capture 95% of the observed shape variation in the pooled dataset. The resultant CVA ordination ( Fig. 9 View Figure 9 ) is highly reminiscent of the result for the proarthron and mesarthron landmark analysis (see Fig. 7 View Figure 7 ) in that comparable amounts of between-groups shape variation are represented on both discriminant axes and the overall geometry of group placement in the discriminant space is identical. Interestingly, for these outline data the apparent shape variance for A. serrulata has increased over its estimate based on the landmark data, whereas the apparent shape variance for the other two species has decreased (compare Figs 7 View Figure 7 and 9 View Figure 9 ). Although strictly speaking the two datasets differ fundamentally in that one represents shape variation over the proarthron and mesarthron and the other represents variation in the mesarthron only, it seems likely that the reason for this apparent difference in shape variation is more a result of differences in the amount of relevant information being sampled by the outline-based (as opposed to the landmark-based) approach than by the differences in their structural scope. Regardless, a Wilks’ L test of the ability of the eigenshape scores to summarize between-species shape differences rejected the null hypothesis of no difference at the 95% confidence level ( Loutline = 2.406; c.v. a=0.05 = 1.860).
The back-calculated, along-discriminant-axis shape models used to interpret geometrically the discriminant space shown in Figure 9 View Figure 9 (see Fig. 10 View Figure 10 ) are more distinct than those in some previous sections of this analysis. This stems from the orientation of the two CVA axes in the space of the shape variables used to define the CVA space, which are tolerably similar to the orthogonal condition (70.6° in the plane of eigenshapes 1 and 2). Note the wide variation that we have seen in these angles to this point in the results presentation. This variation nicely explains why it is so difficult to formulate precise interpretations of the geometric basis for group discrimination in the absence of the shape models, and underscores the utility of the shape modelling through back-projection of the CVA axes procedure.
As for the previous proarthron + mesarthron (landmark-sampled) species results, the outline-based discriminant axis for CV-1 represents a contrast between wide and narrow mesarthra. For the landmark analysis a contrast in width was mainly based on the positions of landmarks 1 and 4 at the base of the mesarthron ( Fig. 8 View Figure 8 ), with only a very slight difference in the distance separating landmarks 2 and 3 (marking the base of the metarthron). The results of the outline analysis reveals the same contrast between wide and narrow mesarthra via the same landmarks but (unlike the results of the landmark analysis) explains the near absence of lateral widening at the base of the metarthron through differences in the curvature of the sinus.
The pattern of shape variation expressed along CV-1 of these outline data dominantly represents a steepening of the gradient formed by the sinus outline sector relative to the lateral margin of the measarthron. This translation is facilitated by a convergence between landmarks 1 and 4, and of the movement of landmark 2 both toward the mesarthral mid-line and posteriorly. There also appears to be a small amount of lateral movement in landmark 3 accompanied by a slight shift of the posterior mesarthral margin in the posterior direction, which is, of course, more pronounced in the vicinity of landmark 2. This orientation of CV- 1 in the geometric space has the effect of placing those mesarthra with relatively broad or laterally expanded sinuses at the lower end of the axis, and those with relatively narrow or laterally compressed sinuses at the upper end.
With respect to CV-2, there is a very slight widening of the sulcus, with very little shift in the rest of A., Allothereua .
the mesarthral outline or the positions of the landmarks themselves.
Using these models to interpret the species discriminant space indicates that A. maculata mesarthra are very distinct from those of A. bidenticulata in that the former exhibit much broader, U-shaped sinuses and the latter much narrower, V-shaped sinuses, with A. serrulata being variable for this character over the entire range of realized geometries. However, unlike the comparisons between genera, all three Allothereua species are similar to each other in terms of the overall depth of the sinus and width of the mesarthron itself. A cross-tabulation analysis of this ordination ( Table 4) shows that, like the proarthron + mesarthron relative warps analysis result, almost 75% of the gonopods can be placed into the correct species groups based on this rather denser set of outline data, with higher consistency given to the A. bidenticulata and A. maculata identifications. Although the outline-based discriminant result is, on the whole, better than the landmark-based result, the difference between the two is marginal and the similarities substantial.


No known copyright restrictions apply. See Agosti, D., Egloff, W., 2009. Taxonomic information exchange and copyright: the Plazi approach. BMC Research Notes 2009, 2:53 for further explanation.