
Culex pipiens, Linnaeus, 1758
|
publication ID |
https://doi.org/ 10.55730/1300-0179 |
|
persistent identifier |
https://treatment.plazi.org/id/03D687AA-FF9A-FFA1-0FBE-FE12FCD867A0 |
|
treatment provided by |
Felipe |
|
scientific name |
Culex pipiens |
| status |
|
3.1. Occurrence and distribution of Culex pipiens View in CoL complex and Culex torrentium
Ace-2 marker molecular results revealed that all samples contained Cx. pipiens , and some points also included Cx. torrentium . Cx. torrentium specimens were identified from only seven collection points (Posof, Galler, Gümüşhane, Ispir Bayburt road, Savsat Artvin, Karakoy, and Sarp). Distribution preferences of Cx. pipiens complex and Cx. torrentium in habitat types of CORINE level 1 were significantly different (Chi-square = 14.692, df = 3, p = 0.002). Although Cx. torrentium is preferred in Agricultural and Forest, seminatural areas, Cx. pipiens complex preferred all habitat types (Agriculture, Artificial, Forest and seminatural, water bodies). Significant differences were found in level 2 habitat type distribution for Cx. pipiens complex and Cx. torrentium (Chi-square = 19.994, df = 8, p = 0.01). Although complex species and Cx. torrentium mainly occurred in the heterogeneous agricultural areas in 2014 and 2015, complex species were found in all level-classified areas except mine, dump and construction sites, and maritime wetland areas. In level 3, complex species mainly occurred in fruit trees and berry plantation areas, and Cx. torrentium mainly occurred in complex cultivation pattern areas. Statistical analysis showed significant differences (Chi-square = 34.020, df = 14 p = 0.002) in CORINE level 3.
According to the CQ11 marker results, Cx. pipiens pipiens and Cx. pipiens molestus biotypes were found in the study areas. Cx. pipiens pipiens include two haplotypes, and Cx. pipiens molestus has one haplotype. The distribution pattern showed significant differences whole 3 CORINE level. Cx. pipiens pipiens haplotype 1 and 2 and Cx. pipiens molestus were mainly found in agricultural areas for CORINE level 1, but significant differences were found at whole four level 1 habitat types (Chi-square = 26.158, df = 3, p = 0.000). In level 2, Cx. pipiens pipiens haplotype 1 and Cx. pipiens molestus were found mainly in heterogeneous agricultural areas, while Cx. pipiens pipiens haplotype 2 distribution patterns were the same with three habitat types (heterogeneous agricultural areas, arable land, and urban fabric). Although proportional differences were found in the distribution pattern in whole level 2 areas, there were no significant differences (Chi-square = 11.171, df = 7, p = 0.131). In level 3, there are no significant differences between the preferences of the area while differences were found in the distribution in the level three areas (Chi-square = 10.867, df = 12, p = 0.540).
3.2. Sequence analysis, assessment of genetic distance, and phylogenetic tree
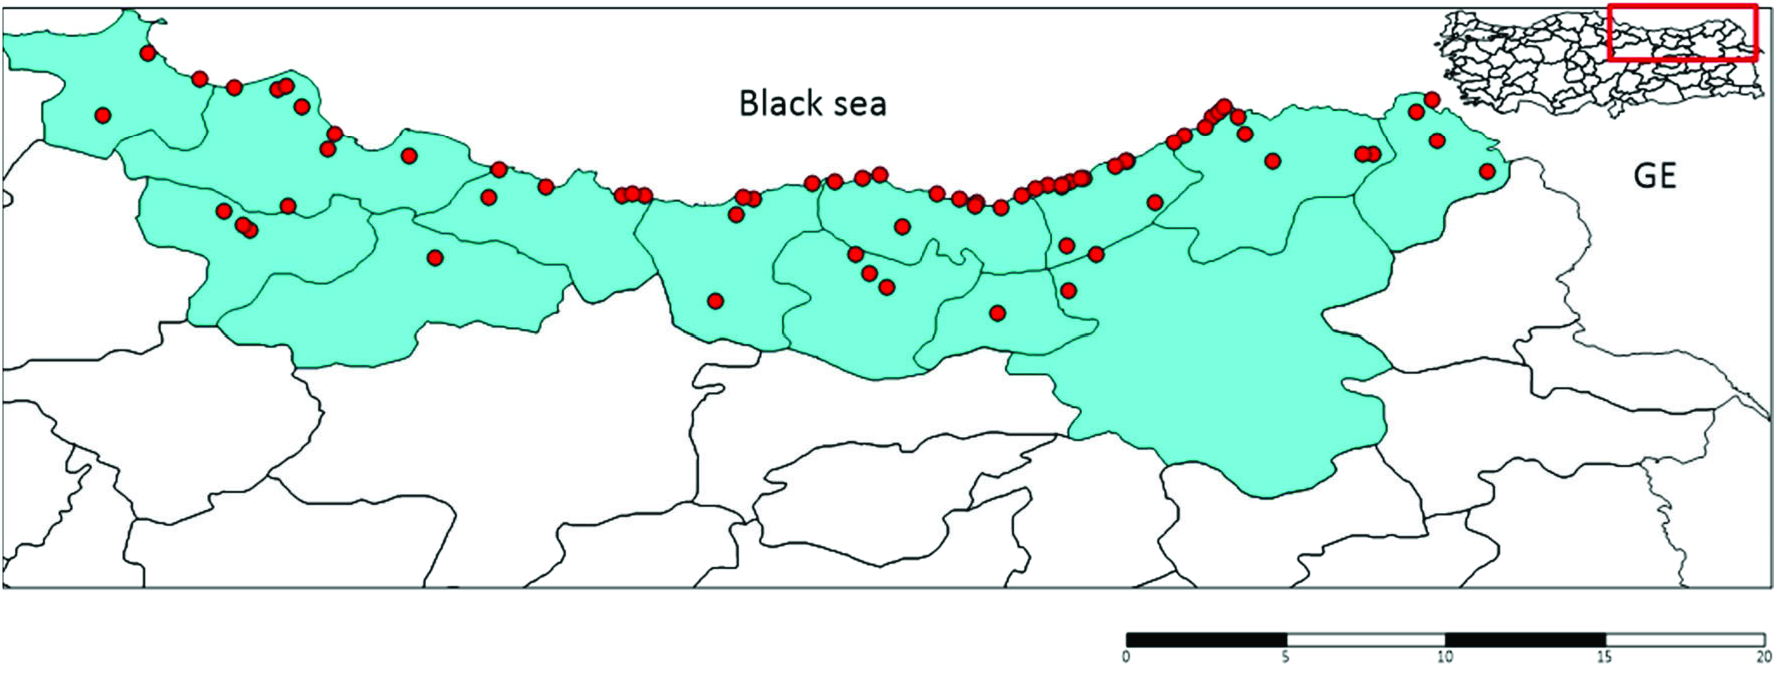
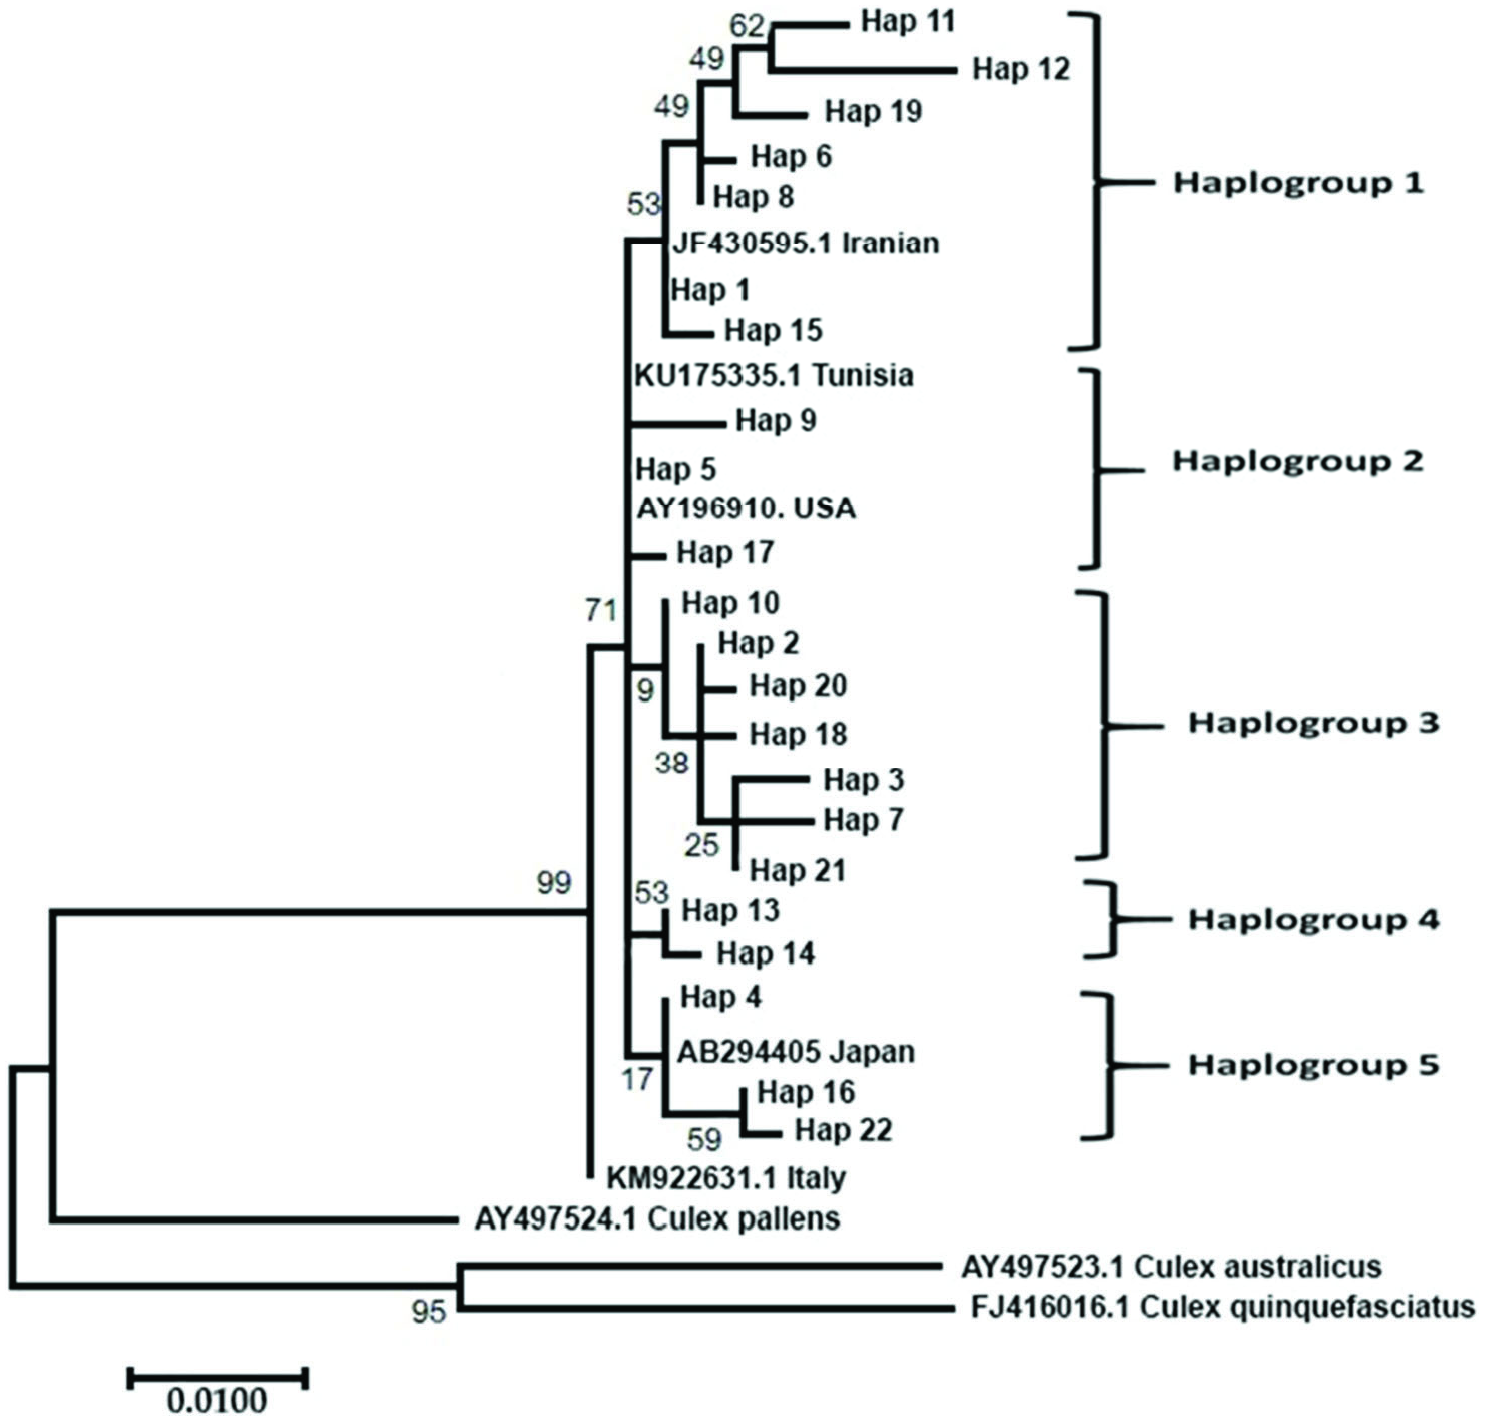
A total of 730 samples from 73 collection points ( Figure 3 View Figure 3 ) (other collection points not included Cx. pipiens complex or Cx. torrentium samples according to the morphological data) were morphologically identified as Cx. pipiens complex or sibling species Cx. torrentium . In total, 146 DNA sequences were used for the molecular analysis of samples. A 651 bp portion of the Ace-2 gene was obtained for all samples. Ace-2 sequences consisted of 24 polymorphic and 21 parsimony-informative sites. The average total A+ T content of the fragment was 51.73%, and the occurrence of both variable and parsimony-informative sites were 0.032 (21/651). The phylogenetic analysis tree of the Ace-2 gene from Cx. pipiens complex was showed in Figure 4 View Figure 4 . The ML tree of Ace-2 sequences of Cx. pipiens complex produced five haplogroups under one main lineage when grouped with Tunisian, USA, Iranian and Japanese samples present in GenBank ( KU 175335.1 for Tunisia, AY196910 for the USA, JF430595.1 for Iran, and AB294405 for Japan). The KM 922631.1 sample from Italy was situated as the sister group of Cx. pipiens . Cx. pipiens pallens ( AY 497524.1) was placed nearest Cx. pipiens complex member. Cx. australicus ( AY 497523.1) and Cx. quinquefasciatus ( FJ 948080.1) samples from GenBank were the farthest from complex members. A total of 22 haplotypes were determined (GenBank accession numbers for Culex pipiens complex sequences OL342323- 44), and haplotype distributions were grouped based on the city from which they were derived ( Table 2). The most frequently occurring haplotypes identified were haplotype 5 (30.28%), haplotype 1 (22.36%), haplotype 4 (9.15%), haplotype 2 (6.33%), and haplotype 10 (5.63%) ( Table 2).
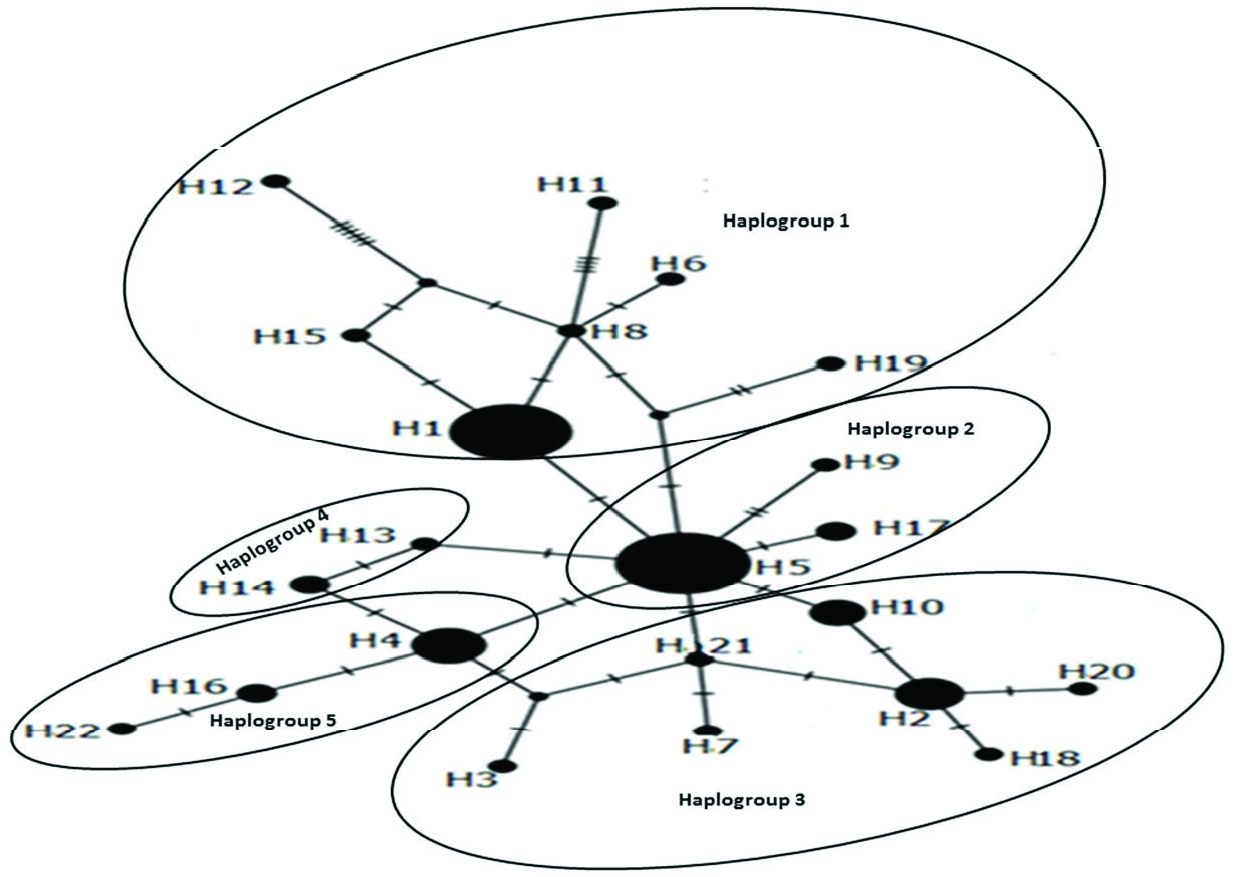
An unrooted haplotype network revealed that Hap5 was the main group, and other haplotypes were one to eight mutational steps different from each other. Haplotype relationships are showed in Figure 5 View Figure 5 . The average nucleotide differences between individuals (k) were 2.07, haplotype diversity (Hd) was 0.848, and nucleotide diversity (π) was 0.00318. Pairwise genetic distances (Fst) between populations are shown in Table 3. According to Fst results, some populations were significantly different than others (e.g., Ordu differs significantly from Ardahan, Artvin, Giresun, Rize, Samsun, Trabzon, Sinop, Bayburt); other areas did not show any significant differences (e.g., Amasya). Although the number of samples varied on the basis of cities, it was found that the regions with a low sample size were located within the main haplotypes except for Sinop and Gümüşhane. Sinop and Gümüşhane samples have own unique haplotypes. The average ܶst value among populations was 0.18 and the average Nm (reproductive migrants per generation) value was 1.10, which indicated that a low degree of genetic differences between populations was observed and gene flow between the populations of the 12 cities and the Georgian population was high.
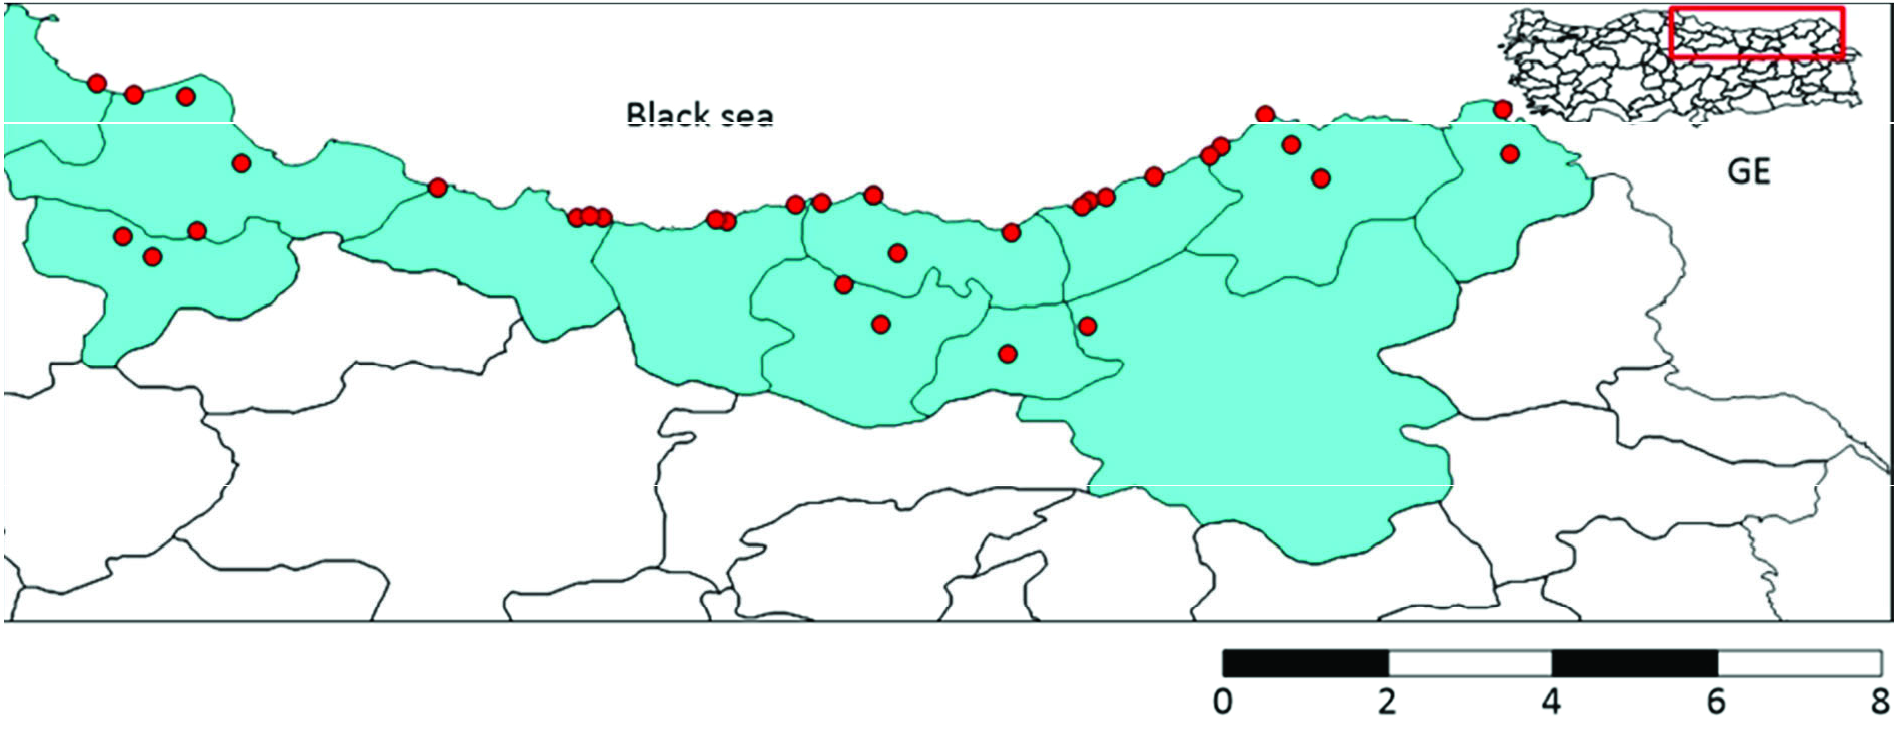
CQ11 marker analysis was carried out to determine biotypes of molestus or pipiens ecological forms. A total of 76 samples from34 collection points were examined ( Figure 6 View Figure 6 ). A 151 bp fragment within the CQ11 microsatellite was obtained for all samples. CQ11 sequences consisted of 7 polymorphic and no parsimony-informative sites. The average total A+ T content was 54.49%.
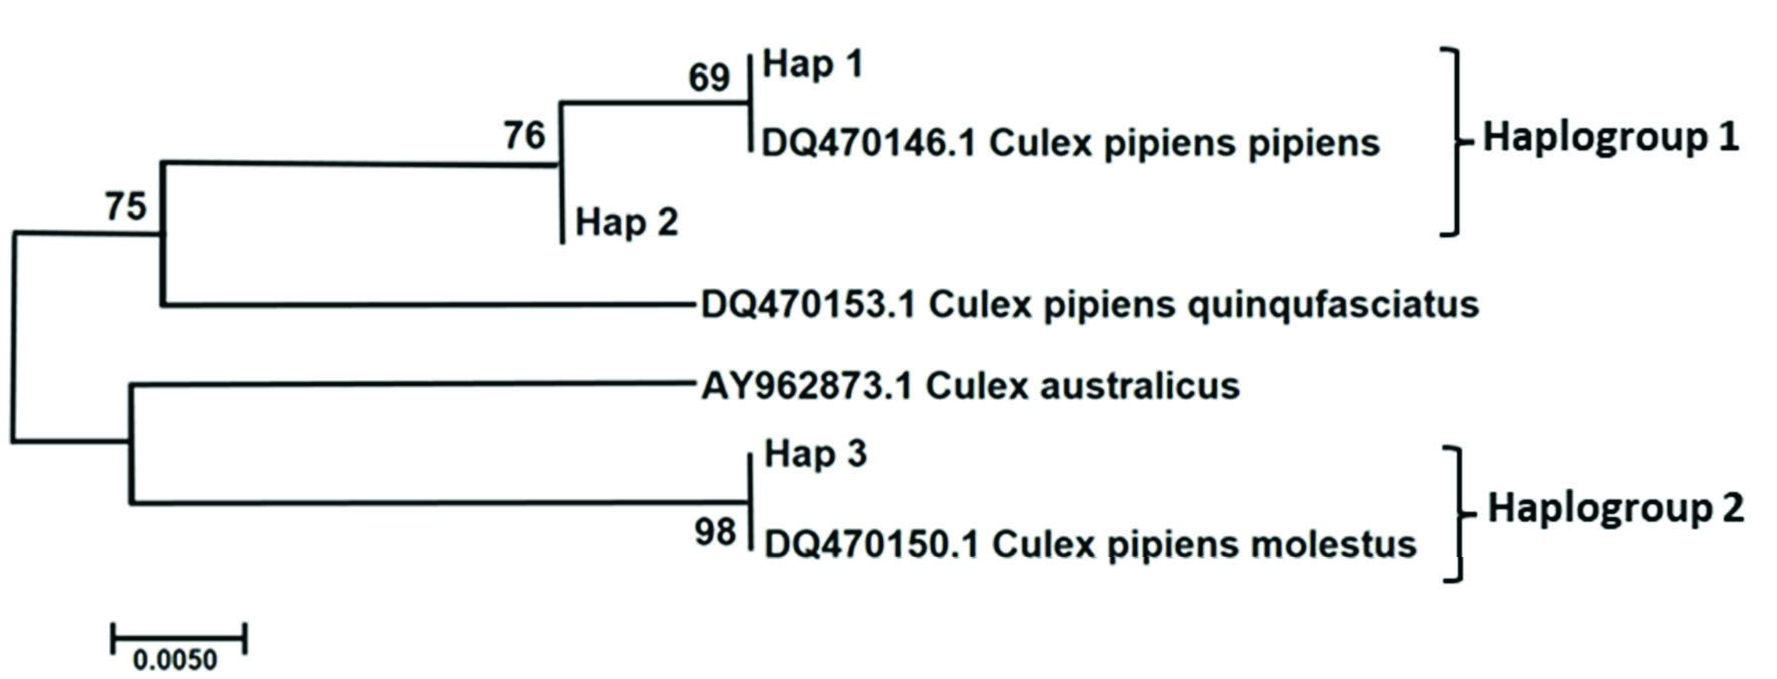
The molecular phylogenetic analysis tree of CQ11 gene from Cx. pipiens complex is shown in Figure 7 View Figure 7 . The ML tree of CQ11 sequences of Cx. pipiens complex produced three haplotypes under two haplogroups (GenBank accession numbers for Culex pipiens pipiens and Culex pipiens molestus sequences OL342320 -22). Although the sample size in the study was different from the cities, whole cities in the study included pipiens and molestus forms haplotypes except for Ardahan, Bayburt, and Gümüşhane. Ardahan and Gümüşhane samples located molestus form haplotype (haplotype 3). Bayburt samples located main haplotype of pipiens form (haplotype 1). Haplotype 2 was determined to be a sister group to haplotype 1, which consisted of a DQ470146.1 Cx. pipiens pipiens sample. The DQ470153.1 Cx. pipiens quinquefasciatus sample from GenBank was the nearest neighbor to the samples identified in the study. Haplotype 3 sequences and the DQ470150.1 Cx. pipiens molestus GenBank sample was the farthest lineage from haplotypes 1, 2. The AY962873.1 Cx. australiacus GenBank sample produced sister branch with hap 3.
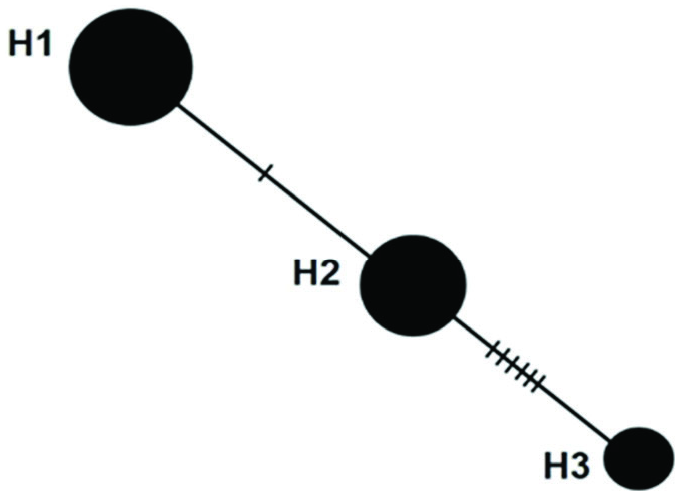
A total of three haplotypes were identified, and the distribution of the haplotypes was affected by the city from which samples were collected ( Table 4). Frequency of haplotype 1 was determined to be 44.59%, haplotype 2 was 36.48%, and haplotype 3 was 18.93%. Haplotype relationships are shown in Figure 8 View Figure 8 . The average nucleotide variation among individuals (k) was 2.36, haplotype diversity (Hd) was 0.64, and nucleotide diversity (π) was 0. 015. Pairwise genetic distances (Fst) between populations are shown in Table 5.
The average ܶst value among populations was 0.050 and the average Nm (reproductive migrants per generation) value was 4.71, which indicates low genetic differences and high degrees of gene flow between the populations of 11 cities in the Black Sea area and the Georgian population.
AKINER et al. / Turk J Zool
| T |
Tavera, Department of Geology and Geophysics |
| ML |
Musee de Lectoure |
| KU |
Biodiversity Institute, University of Kansas |
| KM |
Kotel'nich Museum |
No known copyright restrictions apply. See Agosti, D., Egloff, W., 2009. Taxonomic information exchange and copyright: the Plazi approach. BMC Research Notes 2009, 2:53 for further explanation.