
Thellungiella salsuginea
|
publication ID |
https://doi.org/10.1016/j.phytochem.2014.09.012 |
|
DOI |
https://doi.org/10.5281/zenodo.10519145 |
|
persistent identifier |
https://treatment.plazi.org/id/03C32752-915D-F46F-1B0D-CF9FFC2B0D56 |
|
treatment provided by |
Felipe |
|
scientific name |
Thellungiella salsuginea |
| status |
|
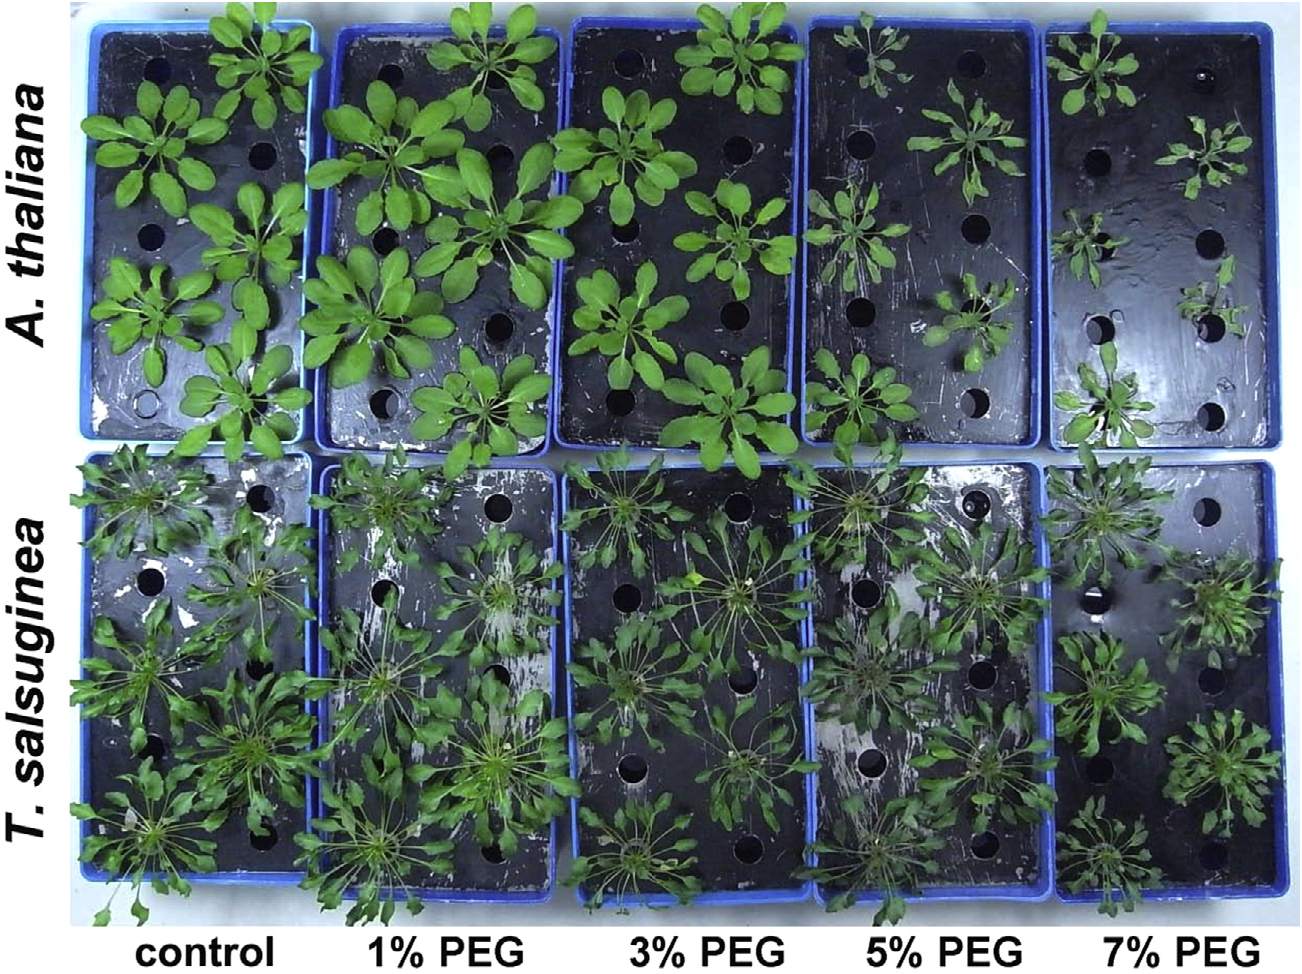
2.1. T. salsuginea View in CoL is more tolerant of water stress than A. thaliana
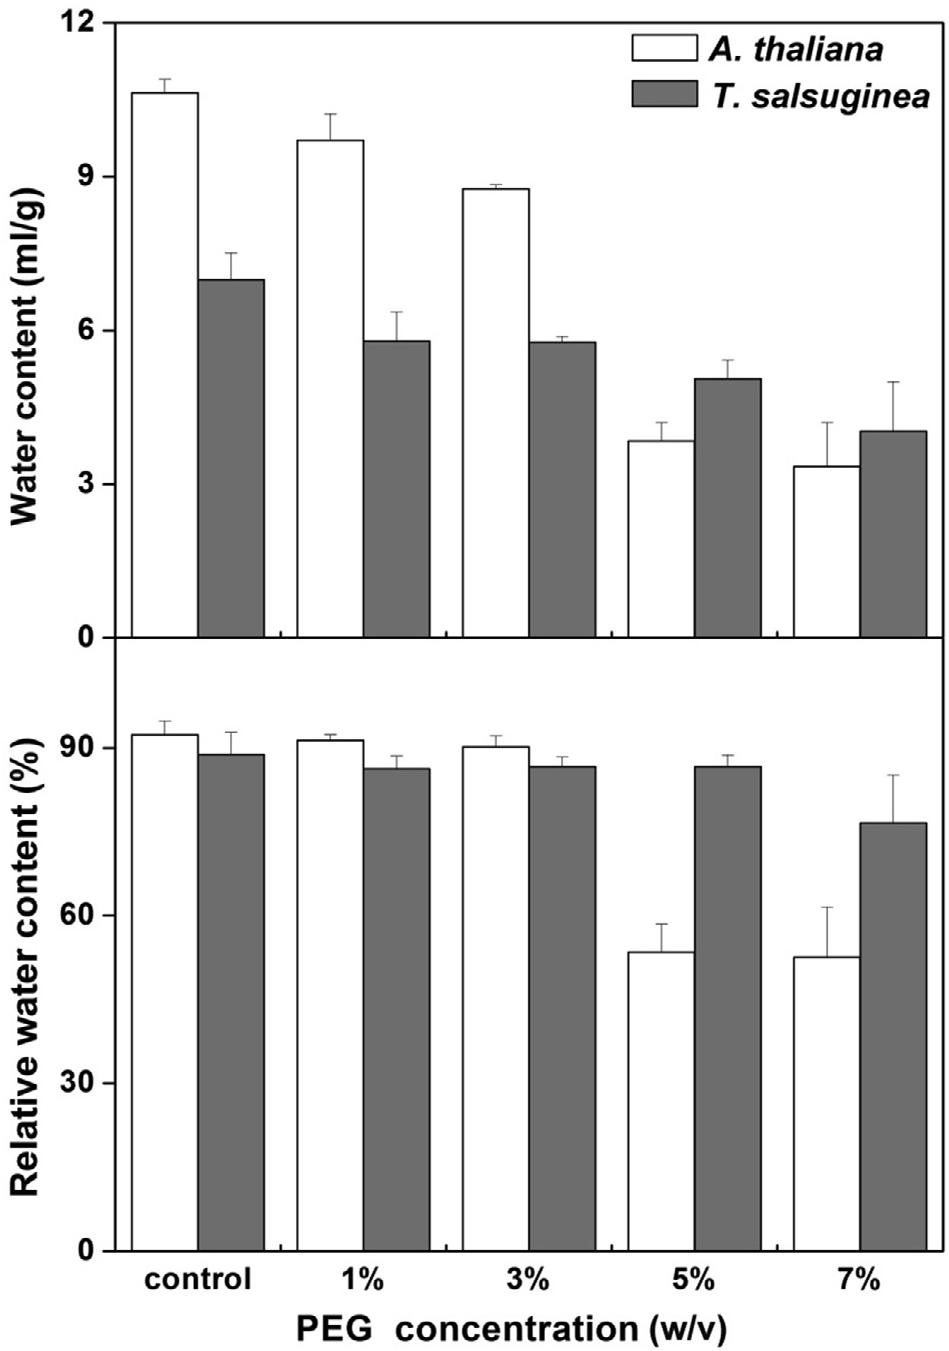
Similarly sized three-week-old A. thaliana and five-week-old T. salsuginea plants were transferred to Hoagland’s solution that contained either 1%, 3%, 5%, or 7% (w/v) PEG to initiate different rates of water stress. After 3 days, plants that received the four different concentrations of PEG-treatment showed distinct responses ( Fig. 2 View Fig ). Whereas the leaves of A. thaliana withered following exposure to 5% PEG treatment, those of T. salsuginea did not, even after treatment with 7% PEG. This indicated that T. salsuginea was more tolerant to water stress than A. thaliana . The water content and relative water content (RWC) were also measured ( Fig. 3 View Fig ). The water content of A. thaliana was much higher than that of T. salsuginea under the control conditions. After being treated with an increasing concentration of PEG, the water content of A. thaliana decreased dramatically, especially at 5% PEG. By contrast, the water content of T. salsuginea decreased slightly. For example, comparison of the water contents of plants under control conditions and those exposed to 5% PEG indicated that the water content of A. thaliana decreased to 36.1%, whereas T. salsuginea decreased to 72.5%. These results showed that T. salsuginea has (1) a constitutively lower water content than that of A. thaliana , and (2) a better ability than A. thaliana to maintain its water content under water stress. In terms of RWC values, those of T. salsuginea and A. thaliana were very similar under control conditions. However, with an increasing concentration of PEG, the RWC of T. salsuginea showed almost no change, whereas that of A. thaliana dropped dramatically after treatment with 5% PEG treatment; the observed trends were similar to those for the water content.
2.2. The photosynthetic capacity of T. salsuginea is higher than that of A. thaliana View in CoL after water stress
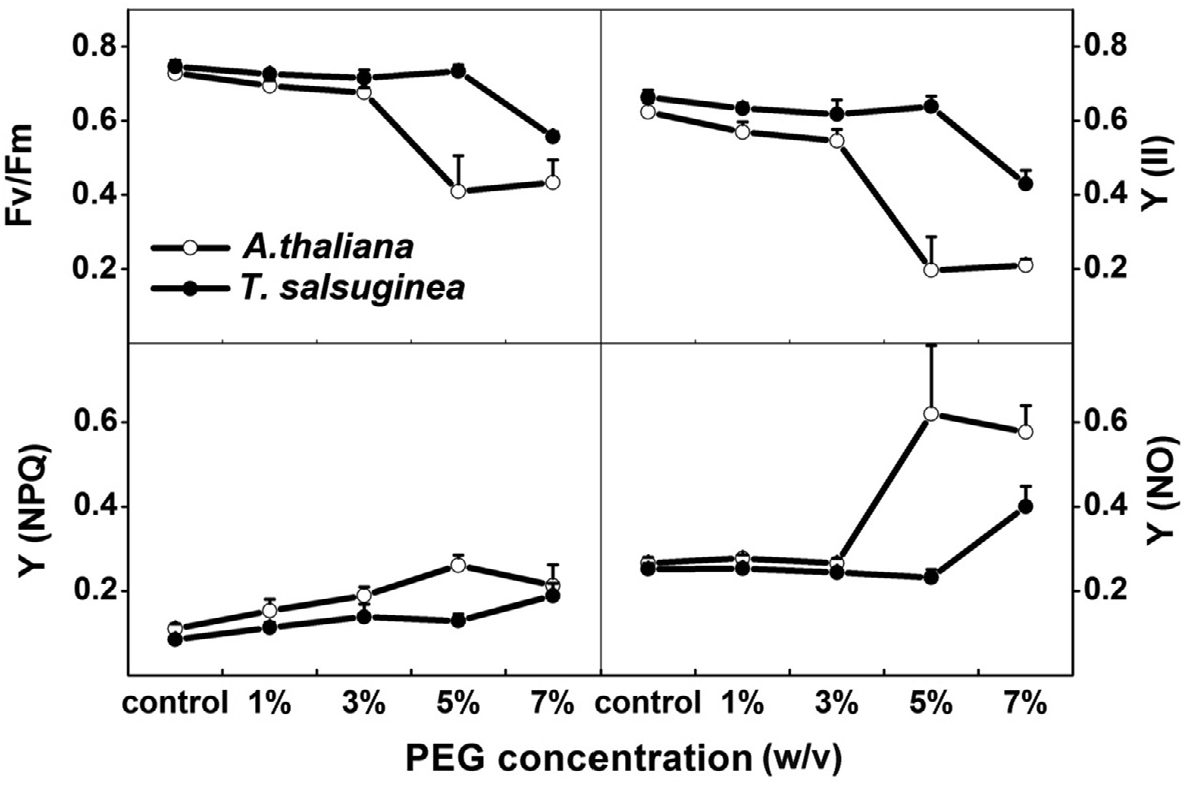
The maintenance of high photosynthetic capacity is also a key factor that controls plant survival under water stress. The photosynthetic parameters of A. thaliana and T. salsuginea were therefore comparatively measured following PEG treatment ( Fig. 4 View Fig ). In general, the photosynthetic capacity of T. salsuginea was higher than that of A. thaliana , especially after treatment with 5% PEG. The maximum photosystem II quantum yield ( F v / F m) and effective photosystem II quantum yield [Y(II)], which represent the capacity of photo energy absorbed by photosystem II (PSII) to be utilized in photochemistry under dark- and light-adapted condition respectively, of A. thaliana decreased to 0.41 and 0.20 under 5% PEG treatment respectively, whereas those of T. salsuginea hardly changed. The Y(NPQ), which indicates the dissipation of energy and represent the ability of photoprotection, of A. thaliana increased with the increasing concentration of PEG treatment and reached a maximum value at 5% PEG, whereas those of T. salsuginea reached a maximum at 7% PEG. The Y(NO), which indicates the degree of photodamage, of A. thaliana increased dramatically following treatment with 5% PEG, whereas those of T. salsuginea began to increase after treatment with 7% PEG and this increase was less than that of A. thaliana . These data confirmed that T. salsuginea is more tolerant of water stress than A. thaliana and suggested that 5% PEG treatment for 3 days led to the most physiological differences between the two species. 5% PEG treatment was thus chosen as water stress conditions for further experiments.
2.3. Lower production of ROS and MDA in T. salsuginea than in A. thaliana View in CoL during water stress
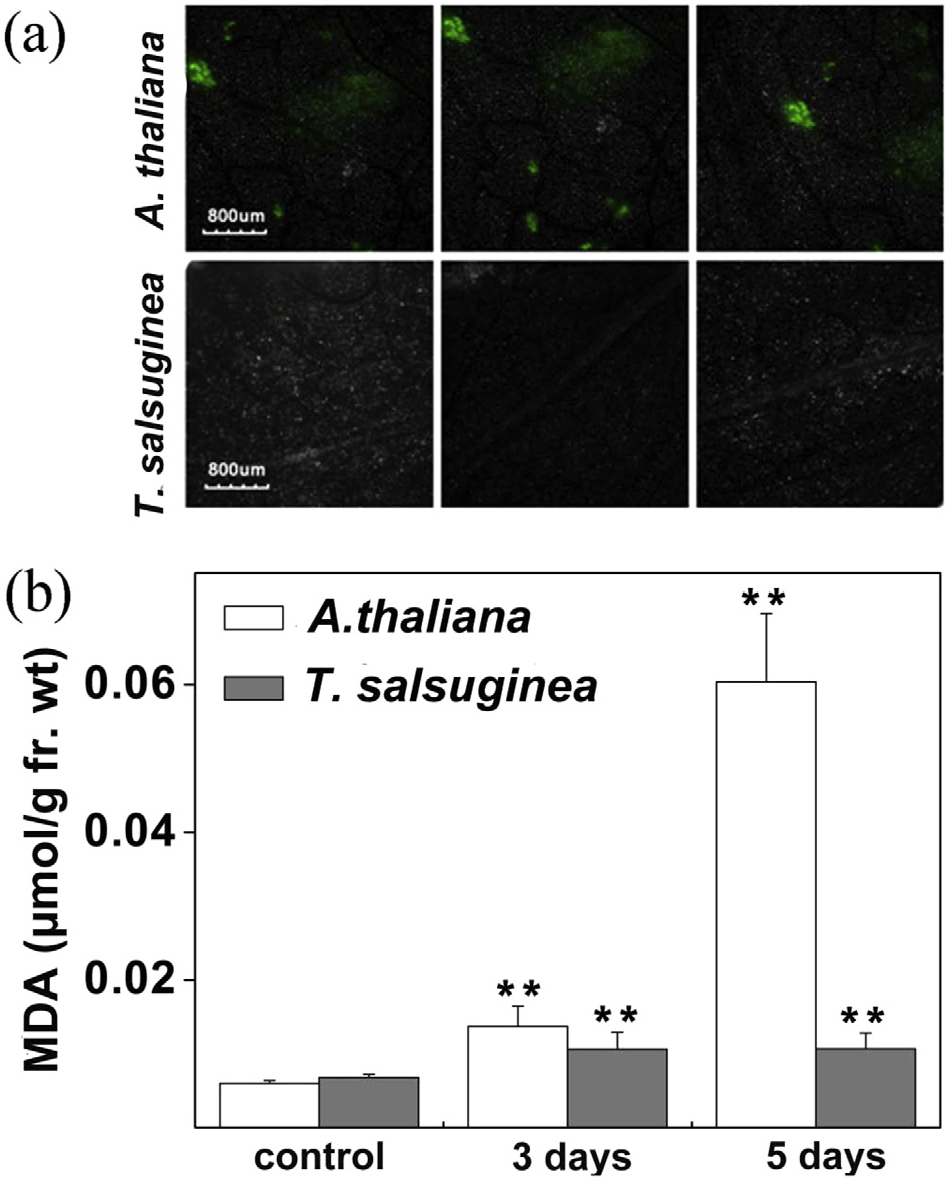
Water stress is usually accompanied by increased production of reactive oxygen species (ROS). The increased abundance of ROS indicated by an increased level of malondialdehyde (MDA) might lead to peroxidation of membrane lipids that harbour polyunsaturated fatty acids. Confocal laser scanning microscopy was thus used to measure the levels of ROS of leaves in T. salsuginea and A. thaliana after their treatment with 5% PEG for 3 days. Evidence of ROS was seen in the leaves of A. thaliana , but not in T. salsuginea ( Fig. 5a View Fig ). The abundance of MDA increased in both A. thaliana and T. salsuginea . Whereas the level of MDA in A. thaliana had reached a maximum level of about 0.06 µmol/g after 5 days of 5% PEG treatment, its level in T. salsuginea was highest 3 days after commencement of treatment with 5% PEG, and remained at about 0.01 µmol/g, which was approximately one-sixth of the level in comparably treated A. thaliana plants ( Fig. 5b View Fig ). Given that the levels of ROS and MDA reflect damage caused by water stress, these results provide biochemical evidence that T. salsuginea is much more tolerant of water stress than A. thaliana .
2.4. The changes of membrane lipids during water stress differed between T. salsuginea and A. thaliana
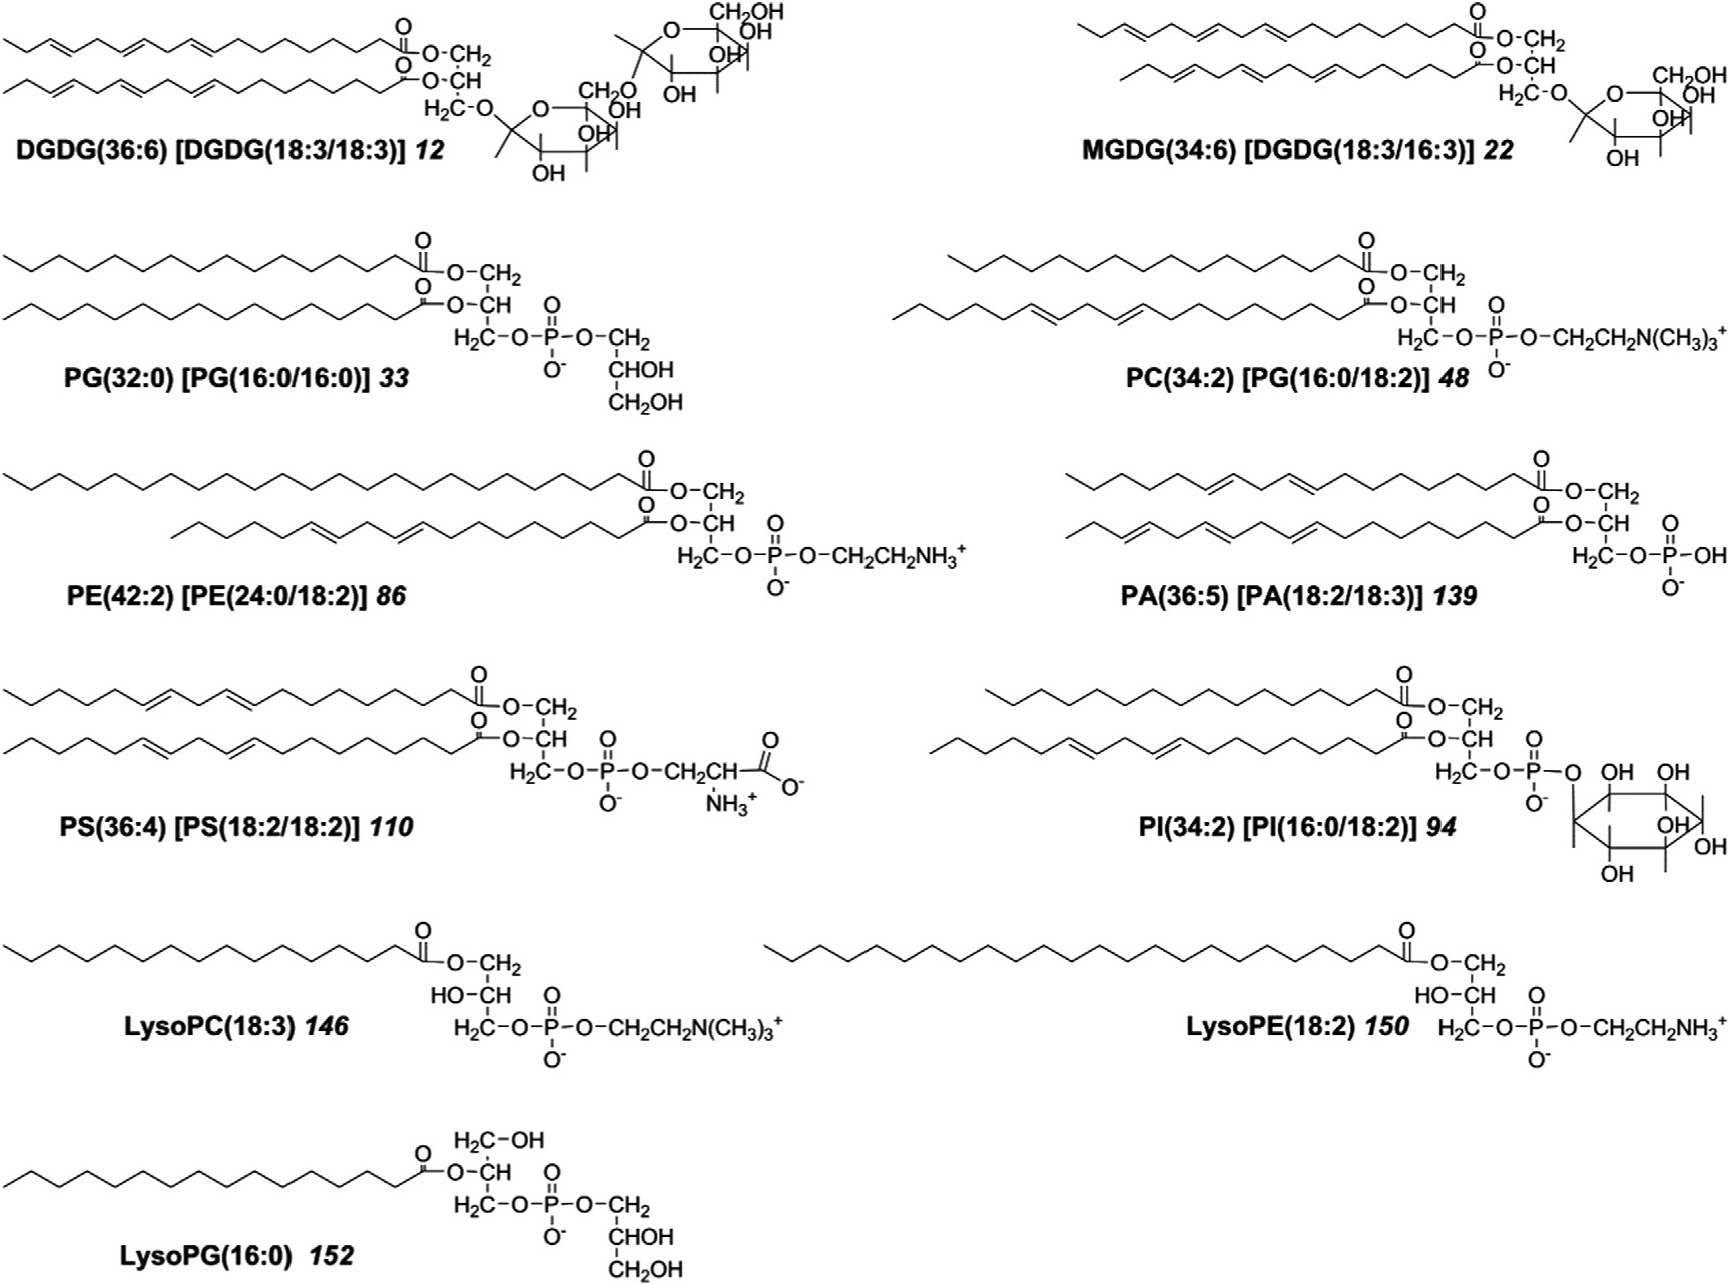
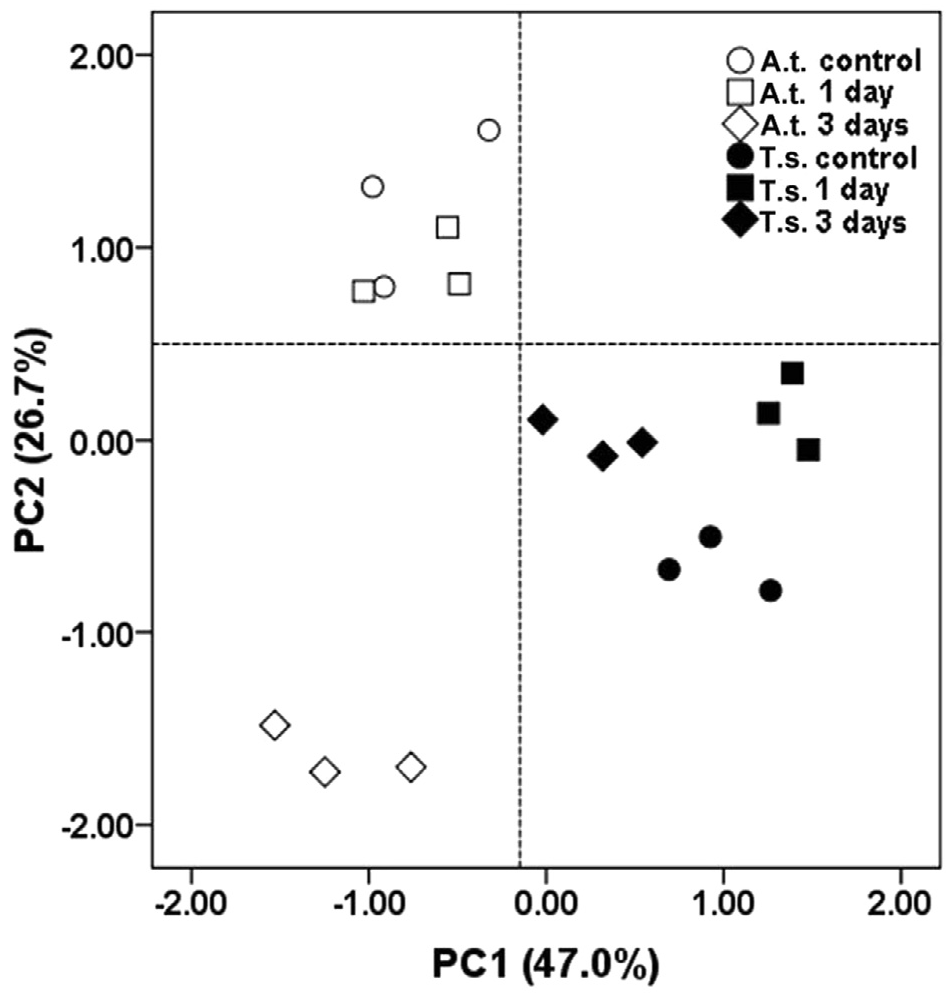
Maintenance of the integrity and fluidity of membranes is crucial for plants to survive water stress. A ESI-MS/MS lipidomics approach based was therefore used to compare changes in membrane lipids between T. salsuginea and A. thaliana after their exposure to water stress. All the compounds analysed are numbered and presented in Supplementary Table S1 View Table 1 . Representative structures of each lipid class are shown in Fig. 1 View Fig . Principal component analysis (PCA) was also introduced into the lipidomics data analysis. The results of this analysis called attention to identifying key statistically significant differences among the species and treatments ( Fig. 6 View Fig ). The first two components, which are used for plotting scores and loadings, explained 73.7% of the variance. Principal component 1 (PC1) clearly describes the separation of T. salsuginea from A. thaliana . Principal component 2 (PC2), in contrast, describes the separation among water stress treatments, especially those in A. thaliana . Examination of loadings indicated that the separation of T. salsuginea from A. thaliana along the PC 1 axis resulted from both plastidic and extra-plastidic lipids, such as phosphatidylglycerol [PG ( 33–45)], phosphatidylcholine [PC ( 46–65)] and phosphatidylethanolamine [PE ( 66–88)], and the separation among treatments along PC 2 axis from plastidic lipids, including MGDG ( 17–32) and DGDG ( 1–16) ( Table 1 View Table 1 ). On the whole, the level of total membrane lipids in A. thaliana showed almost no change on the first day after water stress, but dramatically decreased by approximately 36.4% on the third day ( Table 2 View Table 2 ). In contrast, the level of total membrane lipids in T. salsuginea increased by 18.4% on the first day and decreased to the level found under control conditions on the third day ( Table 2 View Table 2 ). The results suggested that differences in water stress-induced membrane changes between the two species might affect their water stress tolerance.
2.5. The extra-plastidic lipids of T. salsuginea and A. thaliana almost remained unchanged during water stress
The extra-plastidic lipids and plastidic lipids include different kinds of glycerolipids, and stresses having different effects on the abundances of these glycerolipids ( Li et al., 2008). Stress-induced changes in the abundances of plastidic and extra-plastidic lipids were examined separately to establish their relative contributions to overall changes in the abundances of membrane lipids. As shown in Fig. 6 View Fig , the total membrane lipids of A. thaliana and T. salsuginea showed almost no change on the PC1 axis. This result suggested that water stress had almost no effect on the composition of extra-plastidic lipids in either A. thaliana or T. salsuginea . In both species, the level of PC ( 46–65), which was abundant in extra-plastidic lipids, was no different between plants exposed to the control condition and plants subjected to water stress for 3 days. The level of PE ( 66–88) also did not change during water stress. Besides, the level of phosphatidic acid [PA ( 129–140)], which is sensitive to other stresses, also did not change during water stress ( Table 2 View Table 2 ). These results indicated that levels of extra-plastidic lipids were not responsive to water stress in either species in our research.
2.6. The level of plastidic lipids decreased markedly during water stress in A. thaliana
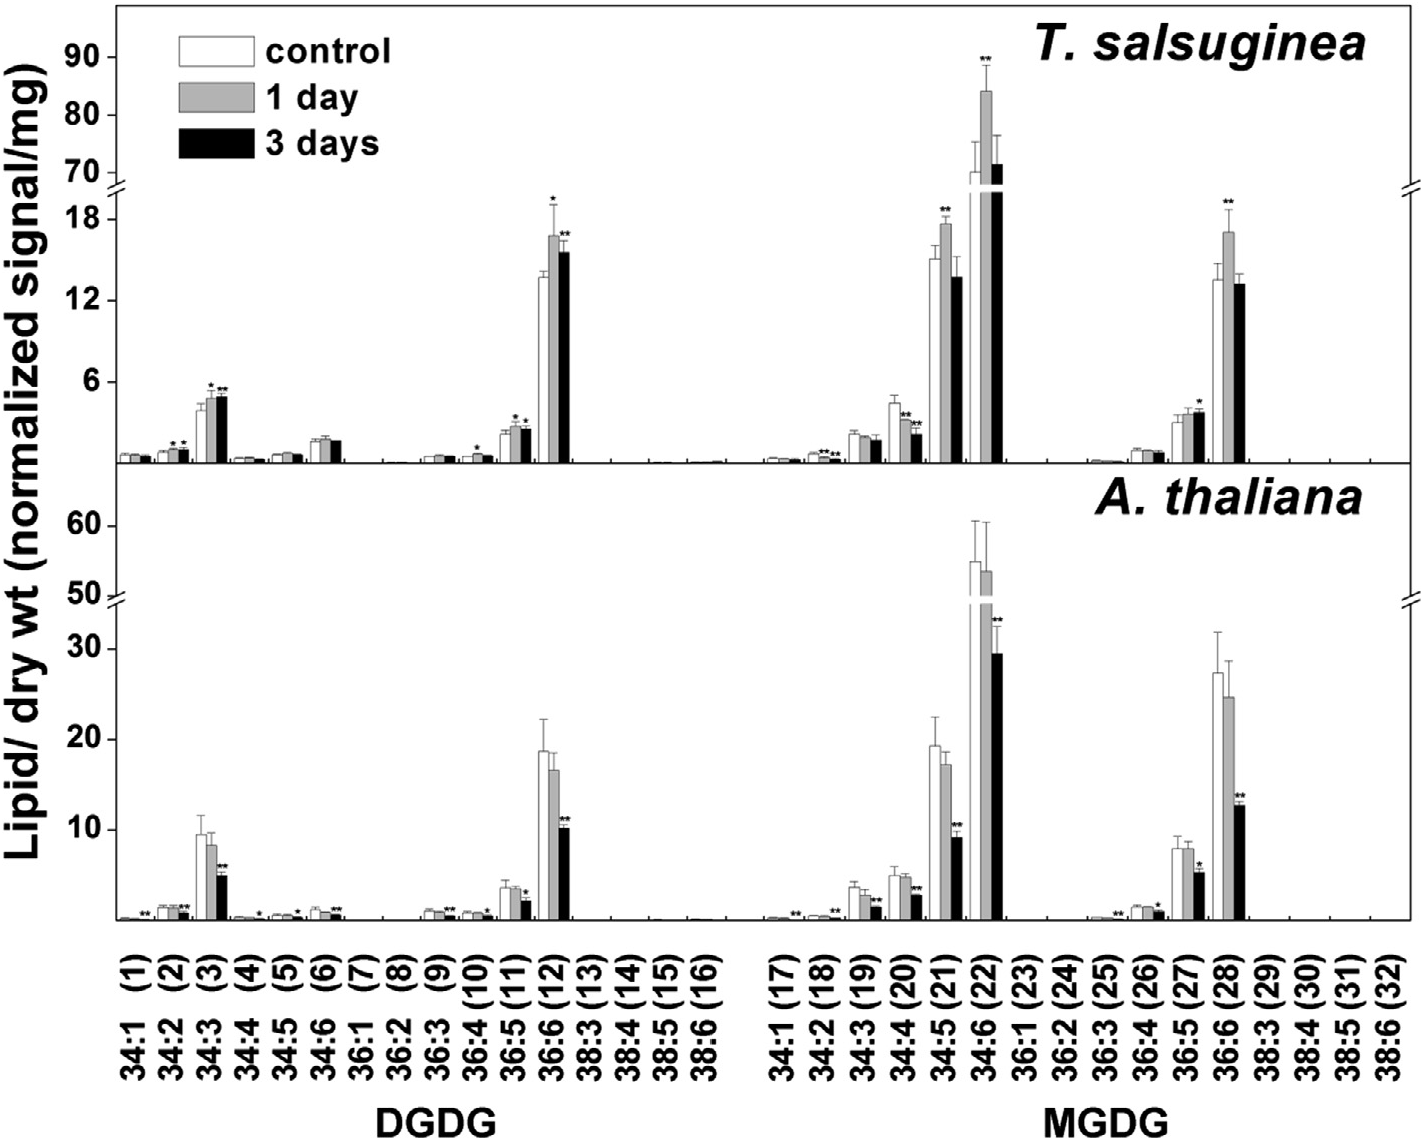
Plastidic lipids, which mainly include MGDG ( 17–32) and DGDG ( 1–16), are the main components of chloroplast membranes. Upon water stress, the level of plastidic lipids in A. thaliana hardly changed on the first day, but then dropped markedly on the third day ( Fig. 6 View Fig ). The level of DGDG ( 1–16) decreased by about 40.0% and that of MGDG ( 17–32) decreased by about 46.3% ( Table 2 View Table 2 ). These decreases occurred in all molecular species of MGDG ( 17–32) and DGDG ( 1–16) ( Fig. 7 View Fig ). The results indicated that the change in the integrity of plastidic membranes was positively correlated with the biochemical and physiological damages described above, and thus suggested that plastid integrity might be a major mechanism that confers water stress tolerance in A. thaliana .
2.7. The level of plastidic lipids increased during water stress in T. salsuginea View in CoL
If the integrity of plastidic membranes makes a major contribution to water stress tolerance, water stress-tolerant plant species should have a superior capacity to maintain membrane integrity relative to water stress-sensitive plant species. This hypothesis was therefore tested by examining changes in the levels of plastidic lipids in T. salsuginea . Following water stress of T. salsuginea , the respective levels of both MGDG ( 17–32) and DGDG ( 1–16) increased by 21.0% and 18.5% on the first day ( Table 2 View Table 2 ). On the third day, the level of DGDG ( 1–16) remained almost as high as that on the first day; the level of MGDG ( 17–32) decreased to the level observed under control conditions. This change increased the ratio of DGDG ( 1–16)/MGDG ( 17–32): increased from 0.22 (control) to 0.26 (3 day) (Supplementary Table S2 View Table 2 ). Increases in the levels of MGDG ( 17–32) and DGDG ( 1–16) during water stress resulted mainly from increases in molecular species such as 36:6 DGDG ( 12), 34:6 MGDG ( 22), and 36:6 MGDG ( 28), which harbour highly unsaturated fatty acids ( Fig. 7 View Fig ). These results indicated that remodelling of plastidic membranes in T. salsuginea occurred by increasing both the level of plastidic lipids shortly after the onset of water stress and the ratio of DGDG ( 1–16)/MGDG ( 17–32) at a later stage of water stress. These results showed that, following water stress, T. salsuginea strengthened the integrity of the plastidic membrane and thus verified the hypothesis described above.
2.8. Water stress decreased DBI values of both plastidic and extra-plastidic membranes in A. thaliana , but increased the DBI of T. salsuginea in plastidic membrane
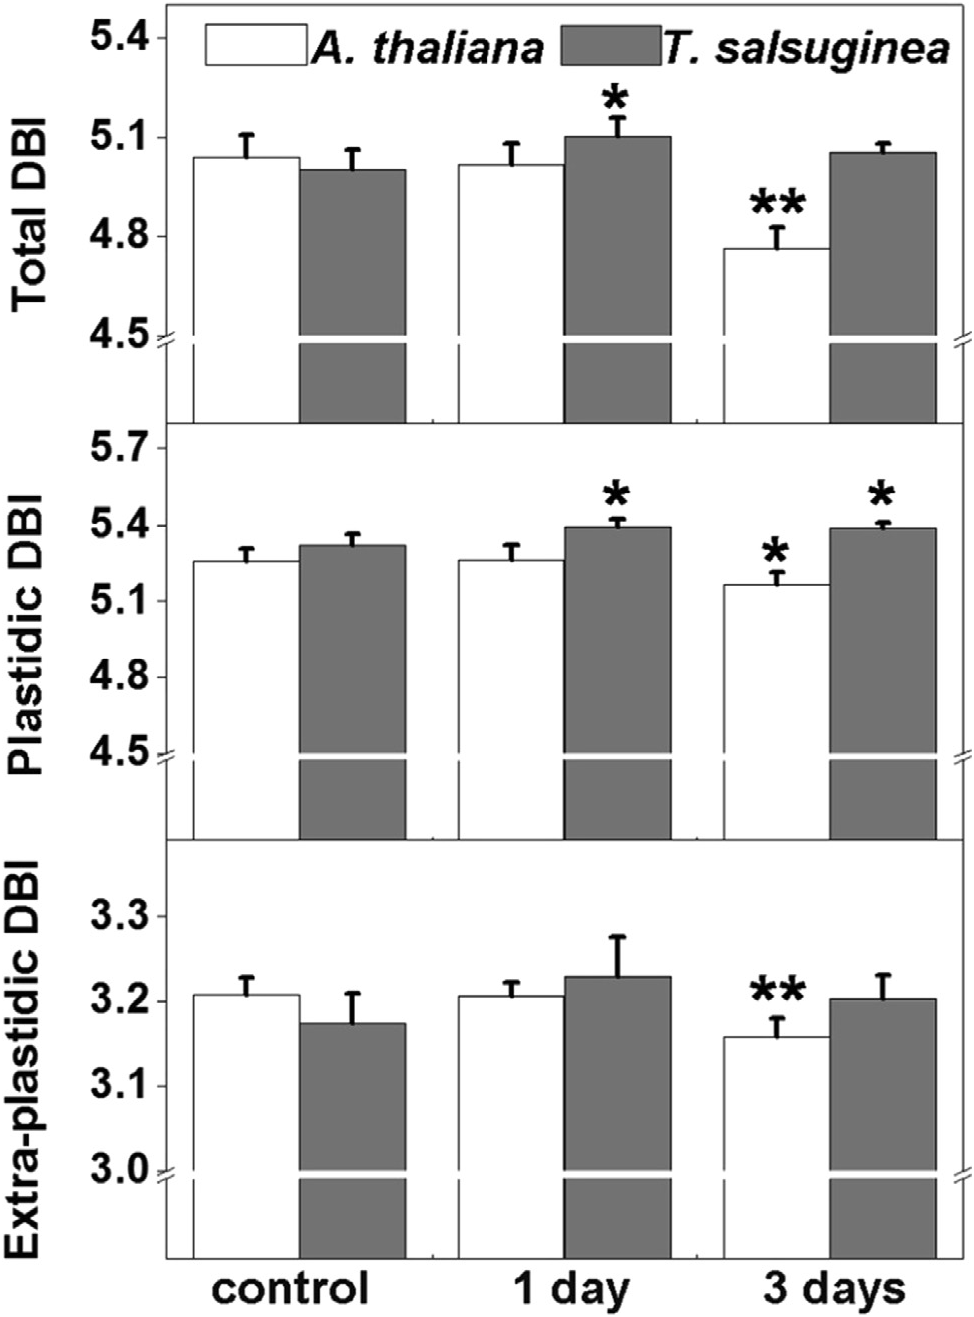
The DBI value reflects the level of unsaturation of acyl chains of glycerolipids. It correlates with the fluidity of the membrane, with a high DBI indicating high fluidity of the membrane and a low DBI indicating a low level of fluidity. The change of DBI differed between A. thaliana and T. salsuginea following water stress ( Fig. 8 View Fig ). The DBI of extra-plastidic lipids of A. thaliana did not change on the first day, but decreased from 3.21 to 3.16 on the third day; by contrast, the DBI of extra-plastidic lipids in T. salsuginea remained unchanged during whole process. The change in the DBI of plastidic lipids resembled that of extra-plastidic lipids in A. thaliana : it remained unchanged on the first day and decreased on the third day. However, the profile of the change in the DBI of plastidic lipids in T. salsuginea was distinctive: whereas it increased on the first day (from 5.32 to 5.39), it remained at the same elevated level on the third day. The increased trend of DBI of plastidic lipids suggested that T. salsuginea was able to improve the fluidity of the plastidic membrane in response to water stress.
2.9. No major changes in LysoPLs occurred during water stress in T. salsuginea View in CoL and A. thaliana
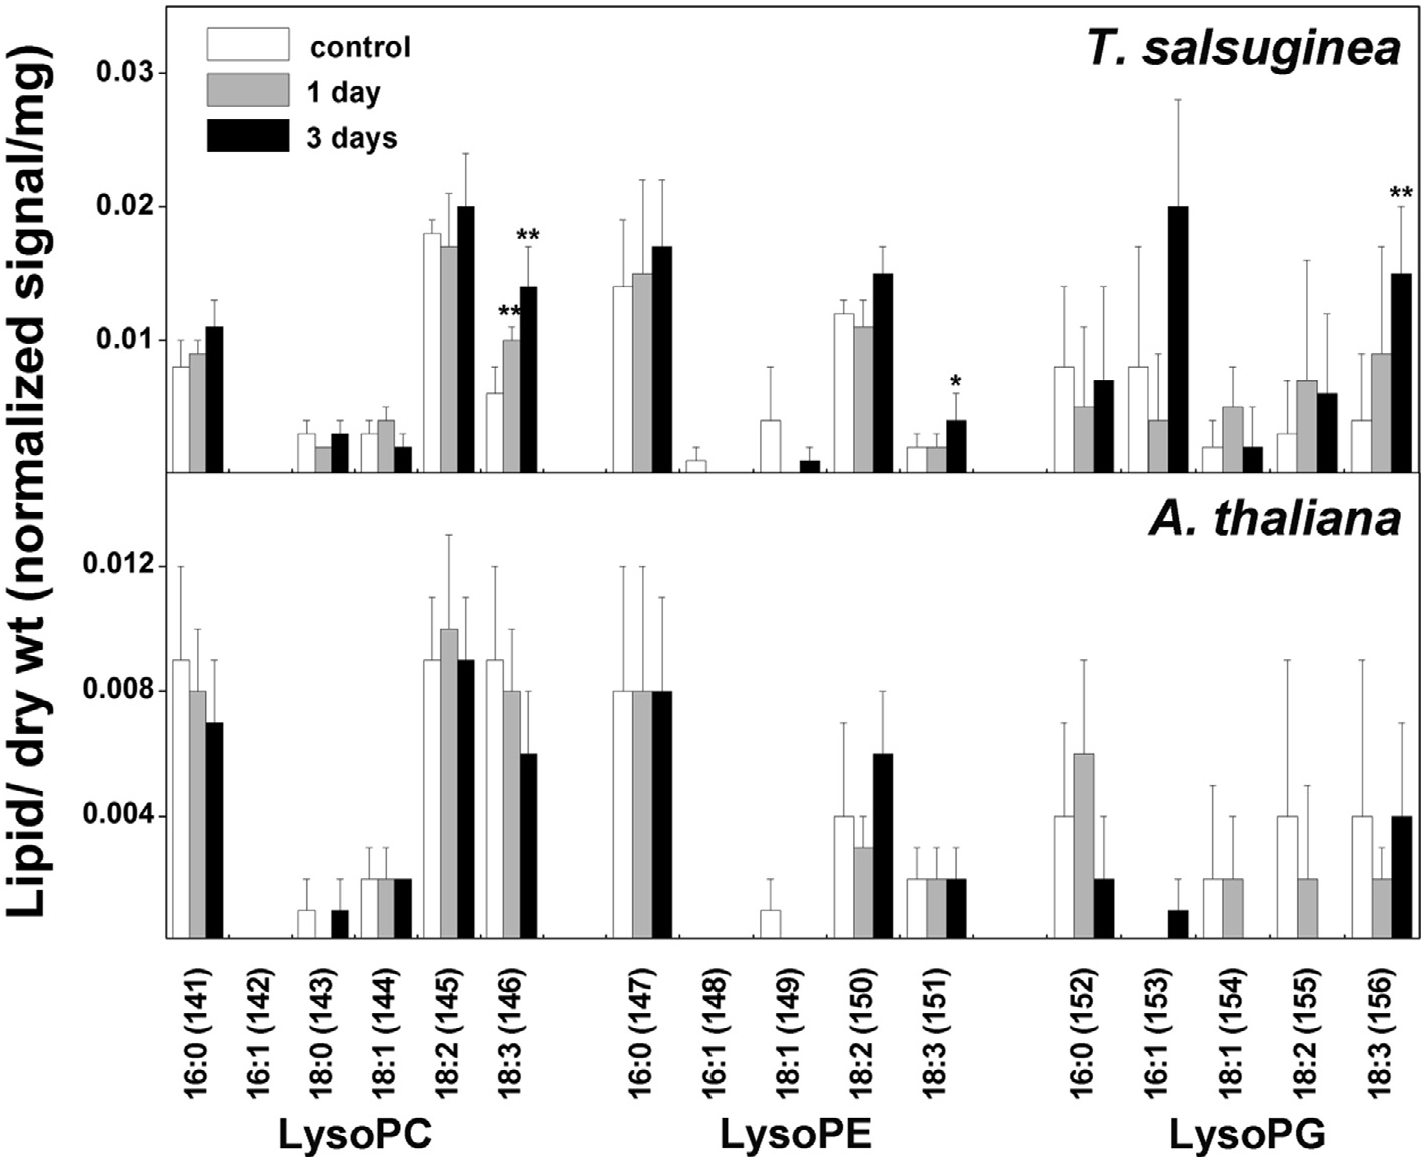
Lysophospholipids [LysoPLs ( 141–156)], which include lysophosphatidylcholine [LysoPC ( 141–146)], lysophosphatidylglycerol [LysoPG ( 152–156)], and lysophosphatidylethanolamine [LysoPE ( 147–151)] are derived from the hydrolysis of phospholipids at the sn-1 or sn-2 position of the glycerol backbone. In comparison with other membrane glycerolipids, the content of LysoPLs ( 141–156) in membranes is low but very sensitive to stresses, such as freezing, cold, and heat shock ( Li et al., 2008; Welti et al., 2002). Upon exposure to stress, LysoPLs ( 141–156) usually increase by five- to 20-fold within hours or even minutes. In the present study, the content of LysoPLs ( 141–156) in A. thaliana and T. salsuginea was also analysed ( Fig. 9 View Fig ). Compared with T. salsuginea , A. thaliana had a lower level of LysoPLs ( 141–156) under both control conditions and after water stress. However, there were no significant changes in the levels of LysoPLs ( 141–156) after either A. thaliana or T. salsuginea were subjected to water stress, except for a slight increase of 18:3 LysoPLs ( 146, 151, 156) in T. salsuginea ( Fig. 9 View Fig ). These results indicated that the changes of LysoPLs ( 141–156) during water stress differed from those following exposure to other stresses.
No known copyright restrictions apply. See Agosti, D., Egloff, W., 2009. Taxonomic information exchange and copyright: the Plazi approach. BMC Research Notes 2009, 2:53 for further explanation.
|
Kingdom |
|
|
Phylum |
|
|
Class |
|
|
Order |
|
|
Family |
|
|
Genus |